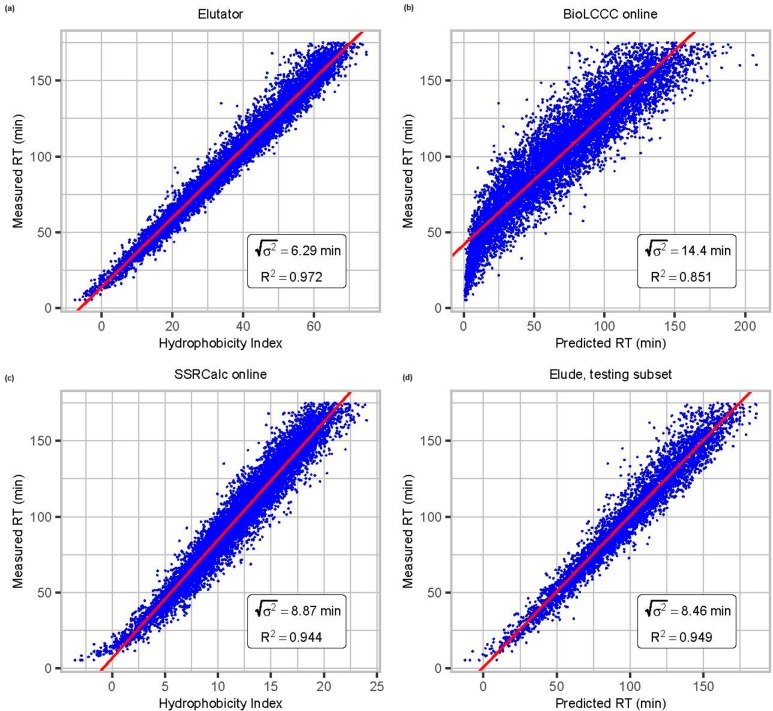
Figure 2.
Comparison of elution retention time prediction models: (a) Elutator,
(b) BioLCCC,29 (c) SSRCalc,30 and (d) Elude.28 Depending
upon the model design the output is either an absolute retention time
or a relative hydrophobicity index, which can be linearly mapped to
the retention time in a particular data set. We here compare the correlation
of predicted and measured retention times of data set I, which is
important for validation. R2 is the coefficient
of determination, and  is the dispersion of the error in minutes.
As Elude cannot be trained on multiple raw files, we here used 50%
randomly chosen PSMs over all raw files for training and the others
for testing.

