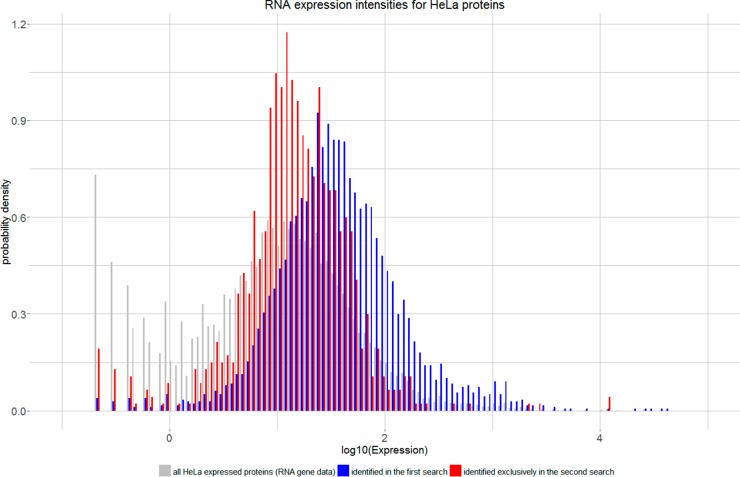
Figure 5.
Comparison of protein expression values. Proteins identified in the second search (red) correspond in a higher proportion to low abundant proteins compared to proteins already identified in the first search (blue). Overall expression values for HeLa cells (gray) have been taken from ProteinAtlas.37

