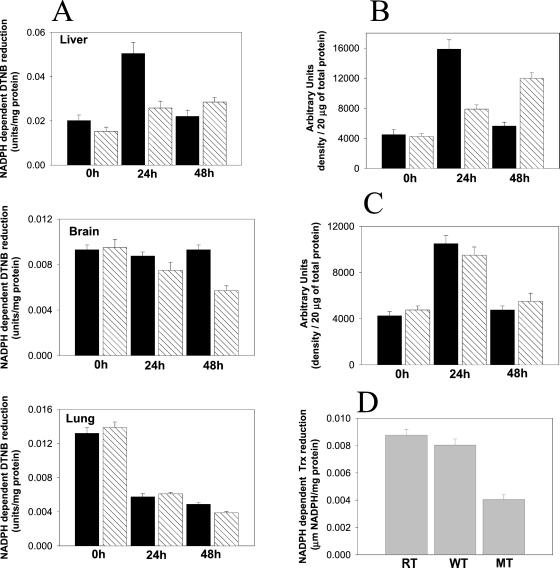
Figure 4.
TR activities and expression in various tissues from WT and MsrA−/− mice and in S. cerevisiae. (A) Liver, brain, and lung; 0h, 24h, and 48h represent activities at different time points (hours) under hyperoxia. Each time point represents five animals. Black bars represent WT; hatched bars represent MsrA−/−. (B) TR level of expression as determined by densitometry analysis of Western blot with anti-TR antibodies probing liver tissues under conditions described for A. Black bars represent WT; hatched bars represent MsrA−/−. (C) Trx expression as determined by densitometry analysis of Western blot with anti-Trx antibodies probing liver tissues under conditions described for A. Black bars represent WT; hatched bars represent MsrA−/−. (D) TR activity in S. cerevisiae: MT, msrA null mutant; RT, reverent of MT. All TR activities were assayed as described (9) and were Trx dependent.

