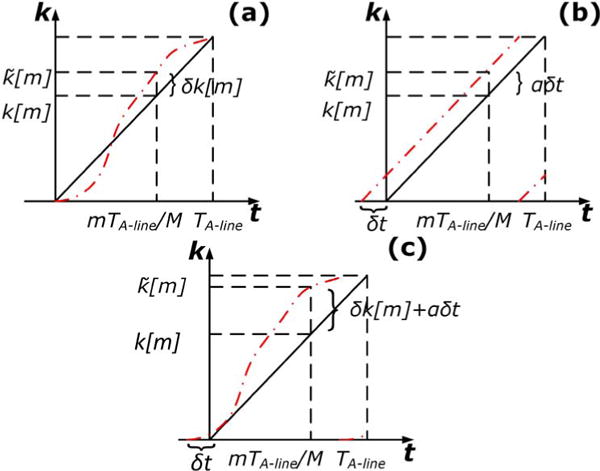
Fig. 1.

Effect of (a) scanning variability, (b) timing jitter, and (c) both on the scanning curve of SS-OCT. represents the actual output wavenumber from the light source. The solid lines represent the ideal scanning curve, while the dashed lines stand for the actual measurements.
