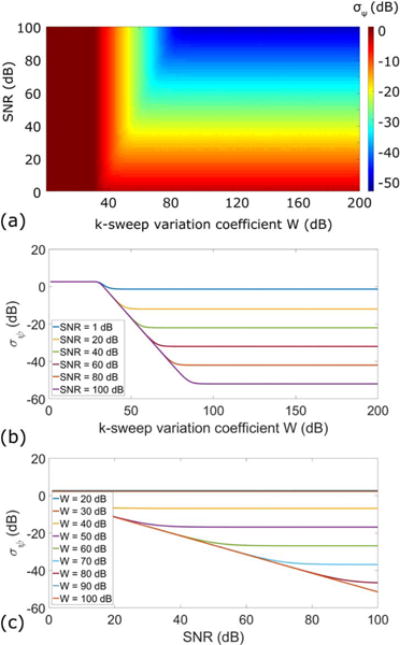
Fig. 3.

Monte Carlo simulation of the proposed model. The calculated standard deviation of the final phase angle is first plotted as a pseudo-color image against SNR and W in logarithmic scale in (a). The σψ are plotted against W in (b) and SNR in (c), respectively.
