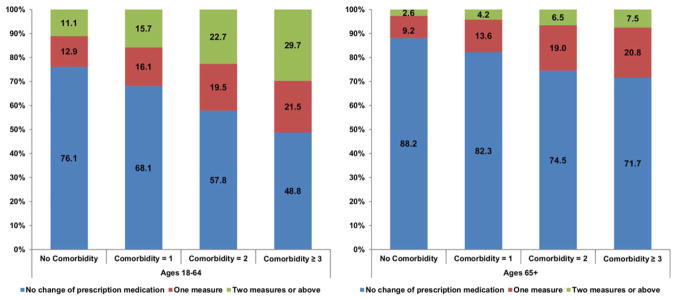
Figure 3.
Patterns of changes in prescription drug use for financial reasons are illustrated by the number of comorbid conditions among cancer survivors only (multivariable, ordered logistic regression stratified by age [18–64 vs ≥ 65 years]; National Health Interview Survey, 2011–2014). Blue areas represent the percentages of cancer survivors that had no change in prescription drug use; red areas, the percentages that had exactly 1 change in prescription drug use; green areas, the percentages that had at least 2 changes in prescription drug use.

