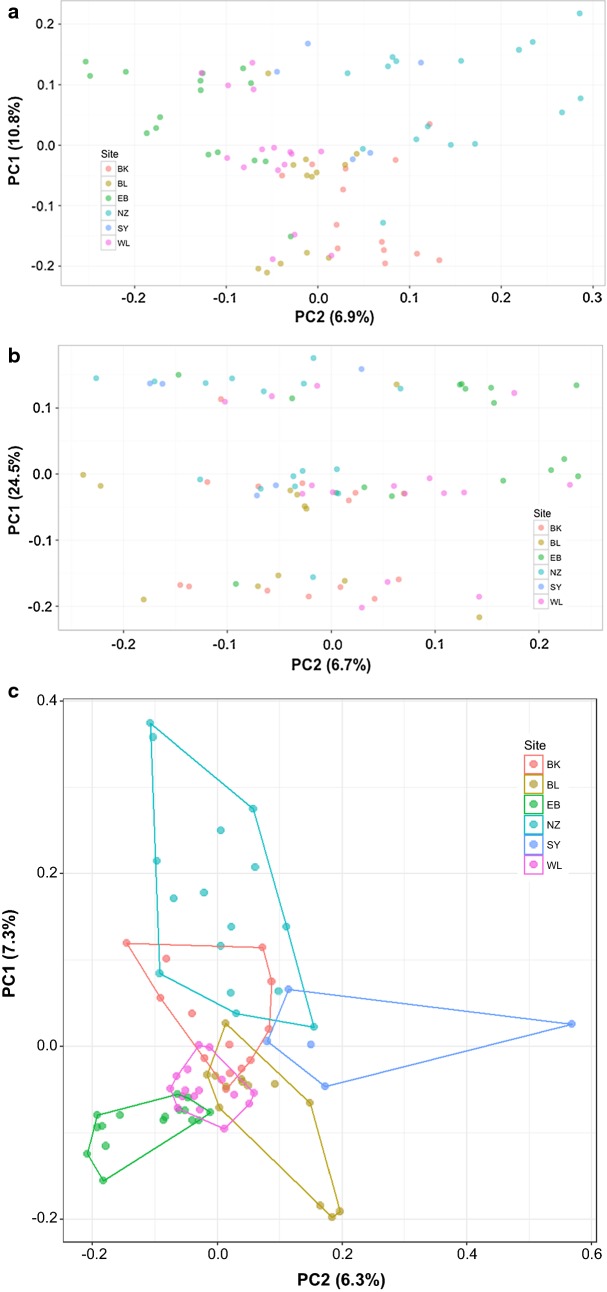
Fig. 2.
Principal component analysis (PCA) plots of the Anopheles gambiae genome-wide SNP dataset (N = 79). In a–c each dot represents an individual mosquito that was sequenced by RADseq technology. Entomological sampling sites are color-coded according to the legend as follows: BK (Bukasa); BL (Bugala); EB (Entebbe); NZ (Nsadzi); SY (Sserinya), and WL (Wamala). The first principal component (PC1) and its percentage variance are represented by the y-axis and, likewise, the x-axis represents the second principal component (PC2) and its percentage variance. a Plot of 5175 SNPs mapped to the AgamP4 genome [42]. b Plot of 1078 SNPs mapped to chromosome 2L [42]. c Plot of 4097 SNPs mapped to the AgamP4 genome [42] after removal of chromosome 2L SNPs

