
Figure 3.
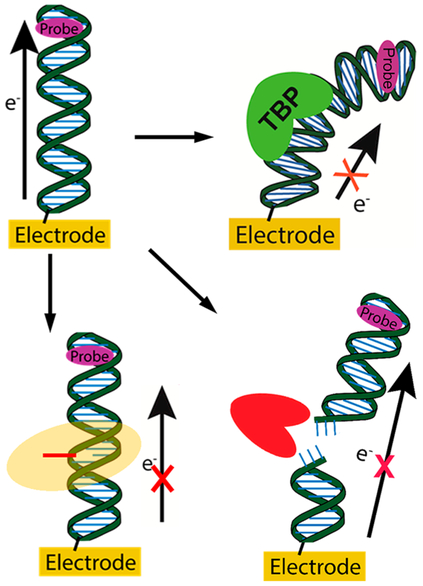
DNA CT monitoring enzymatic activity. Signal is first established for the DNA using a redox probe in the absence of protein. (Top right) Upon binding of a TATA-binding protein (TBP, green), the DNA CT signal to the intercalated redox probe (purple) decreases. (Bottom left) Upon flipping out a base (red line) by a base-flipping protein (orange halo), the yield of DNA CT decreases. (Bottom right) DNA CT to an intercalated redox probe occurring through duplex DNA decreases upon cutting the DNA duplex using a restriction enzyme (red).