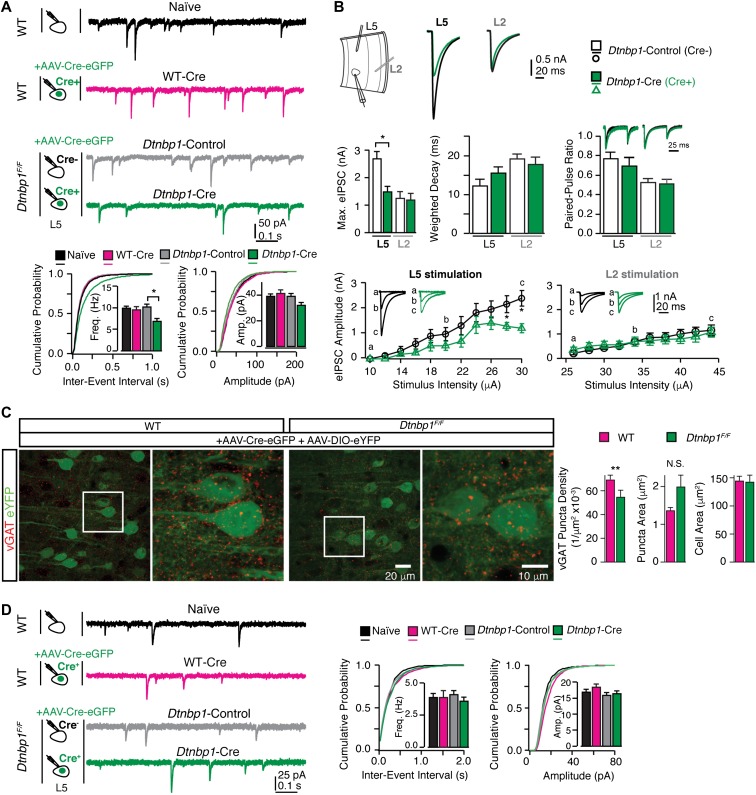
Figure 2.
DTNBP1 elimination in layer 5 pyramidal neurons of mPFC specifically diminished GABAergic transmission. (A) Layer 5 pyramidal neurons in the mPFC of Dtnbp1F/F mice exhibited reduced mIPSC frequency upon AAV-Cre-eGFP infection (14 days), compared to their uninfected neighboring neurons. Top panel: experiment configuration and representative traces of mIPSCs. Bottom panel: cumulative distribution and quantifications (insets) of mIPSC frequency (Freq) and amplitude (Amp). Neurons from four groups were recorded and compared: neurons from WT mice without virally injection (Naïve, n = 28); virally infected neurons from WT mice (WT-Cre, n = 21); virally uninfected neurons (Dtnbp1-Control, n = 18), and virally infected neurons (Dtnbp1-Cre, n = 23) in Dtnbp1F/F mice (three mice each group, Kolmogorov–Smirnov test, P = 0.01, groups 3 and 4). (B) Virally infected (AAV-Cre-eGFP, 14 days) layer 5 pyramidal neurons (Dtnbp1-Cre) in the mPFC of Dtnbp1F/F mice exhibited diminished eIPSCs compared to their uninfected neighboring neurons (Dtnbp1-Control), with stimulation electrode located in layer 5 but not in layer 2/3 (n = 11 and 12 for Dtnbp1-Control and Dtnbp1-Cre with L5 stimulation, respectively; n = 13 and 17 for Dtnbp1-Control and Dtnbp1-Cre with L2 stimulation, respectively; three mice each group). Top panel (left to right): experiment paradigm; traces of averages of maximal eIPSCs recorded from layer 5 pyramidal neurons stimulated by electrodes placed in layer 5 (L5) or layer 2/3 (L2), respectively. Middle panel (left to right): averaged maximal eIPSCs quantifications (Kolmogorov–Smirnov test, P = 0.02, L5 stimulation); comparison of weighted-decay of maximal eIPSC of Dtnbp1-Cre and Dtnbp1-Control neurons from Dtnbp1F/F mice; paired-pulse responses for eIPSCs of Dtnbp1-Cre and Dtnbp1-Control neurons from Dtnbp1F/F mice. Traces on top showed the averaged eIPSCs from Dtnbp1-Control (black) and Dtnbp1-Cre neurons (green), normalized to the peak of the first IPSC. The paired pulses were delivered at 100 ms interval. Bottom: input–output curves of eIPSCs stimulated by a group of electrical stimuli with various intensities (Kolmogorov–Smirnov test, P = 0.03 for L5 stimulation). Insets, eIPSC traces at indicated stimuli. (C) Reduced vGAT (red) puncta density in perisomatic regions of layer 5 pyramidal neurons in Dtnbp1F/Fmice compared to WT mice. Left, representative images of vGAT immunostaining with blown-up images of the regions in white squares on right side; right, bar graphs were quantifications for puncta densities, puncta sizes, and soma sizes of analyzed neurons (Dtnbp1F/F, n = 85 neurons; WT, n = 59 neurons; three mice each group; Mann–Whitney U-test, P = 0.0011 for vGAT density comparison). (D) Deletion of DTNBP1 from mPFC pyramidal neurons did not change excitatory synaptic transmissions. Left panel: experiment configuration and representative traces of mEPSCs. Right panel: cumulative distribution and quantifications (insets) of mEPSC frequency (Freq) and amplitude (Amp). mEPSCs were recorded from virally infected neurons in Dtnbp1F/F mice (Dtnbp1-Cre, n = 26) 14 days after AAV-Cre-eGFP injection, which showed no differences compared to three other groups: neurons from WT mice without viral infection (Naïve, n = 31); virally infected neurons from WT mice (WT-Cre, n = 19); and uninfected neurons from Dtnbp1F/F mice (Dtnbp1-Control, n = 26). Error bars are mean ± SEM. *P < 0.05; **P < 0.01.

