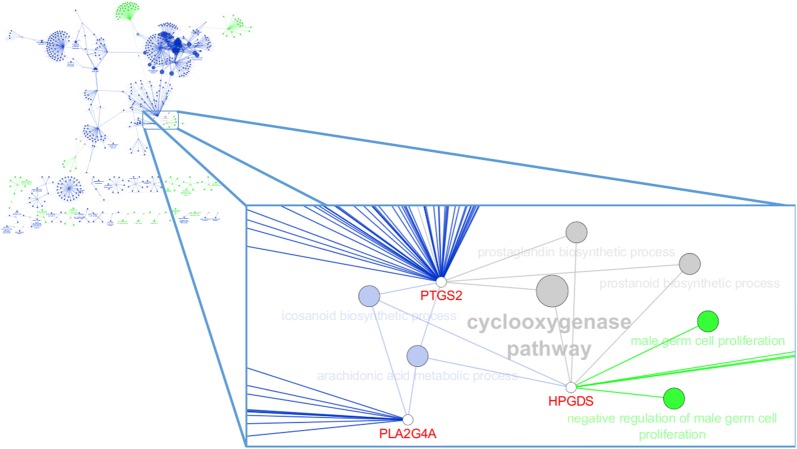
Fig. 3.
Gene network of biological processes for progressive motility. Complete network and important shared pathways (with zoom) are shown. Blue color indicates pathways for the Large White type line (L1) and green color indicates pathways for the Landrace type line (L2). Processes shared by PTGS2 and PLA2G4A genes (L1) and HPGDS gene (L2) are connected by blue nodes. Processes shared by PTGS2 and HPGDS are connected by grey nodes. Green dots are biological processes for HPGDS

