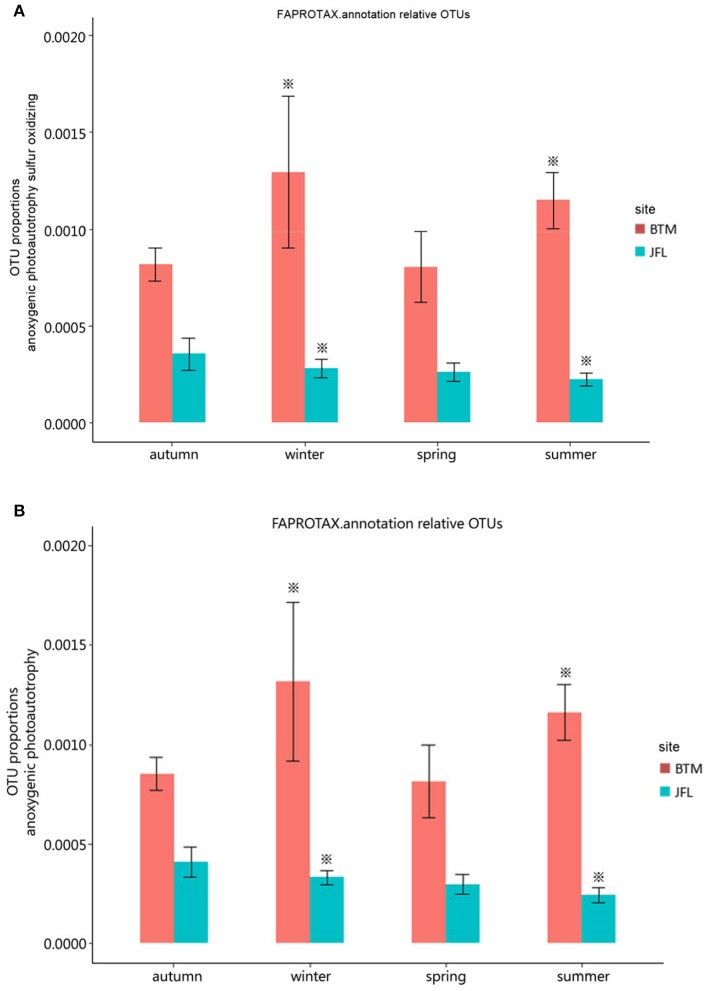
Figure 5.
Functional groups with significant difference in carbon cycle. Autumn and winter represent the autumn and winter of 2015, respectively. Spring and summer represent the spring and summer of 2016, respectively. The asterisks represent significant differences between BTM and JFL at the same season (P < 0.05). (A) OTU proportions of anoxygenic photoautotrophy sulfur oxidizing. (B) OTU proportions of anoxygenic photoautotrophy.

