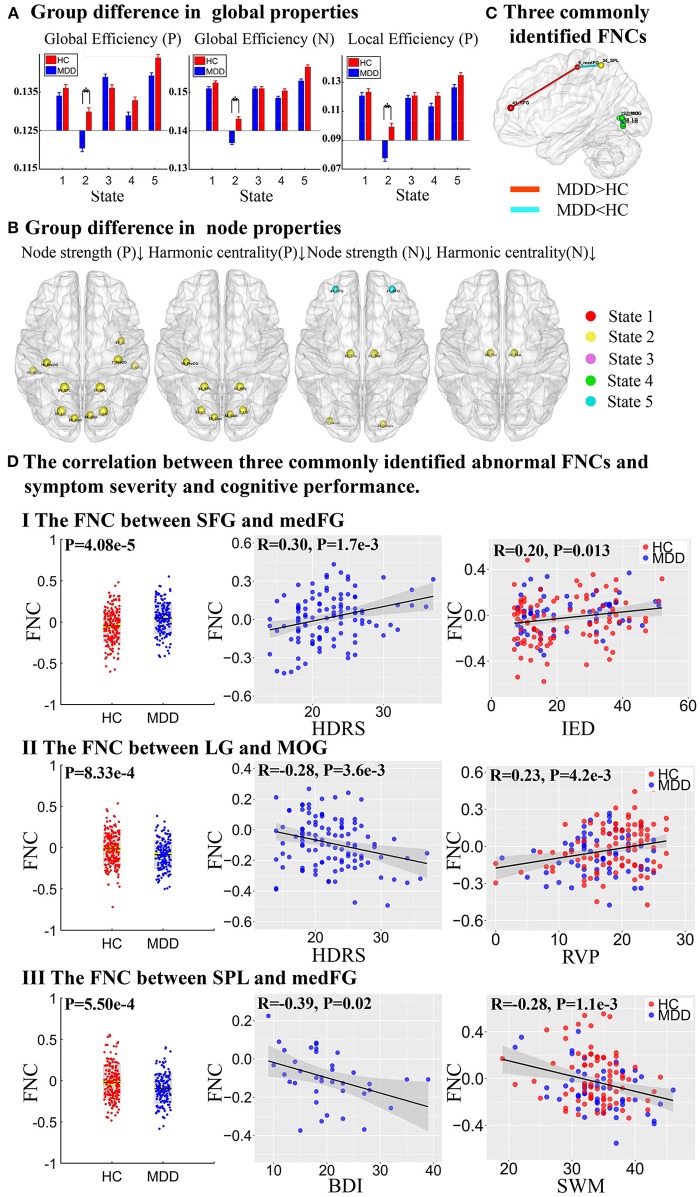
Figure 4.
Group difference in network properties and three commonly identified abnormal FNCs. (A) Group difference in global efficiency and local efficiency in positive network (P) and negative network (N) (The asterisks indicate p < 0.05, FDR corrected). (B) Group difference in node strength and harmonic centrality (p < 0.001, FDR corrected), where the upward arrow and the down arrow represent increased and decreased node properties, respectively. (C) Three commonly identified FNCs in different states. Red lines represent increased FNCs while blue lines represent decreased FNCs in MDD patients. (D) The partial correlation between three commonly identified abnormal FNCs and symptom severity and cognitive performance.

