Fig. 4.
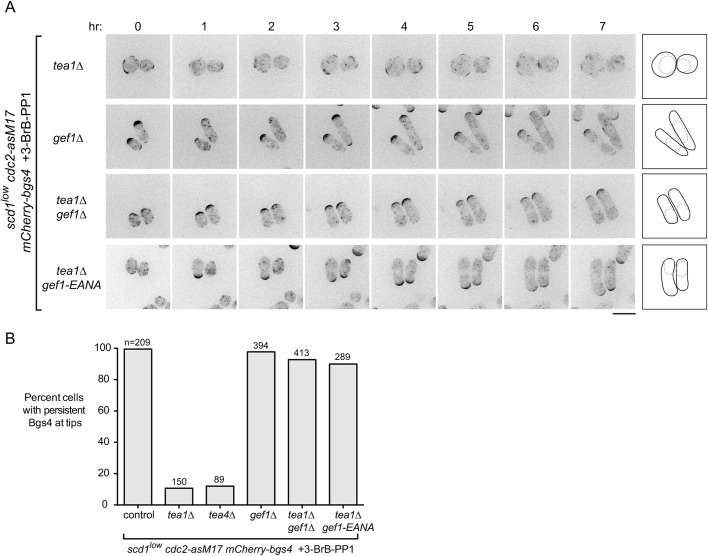
Loss of gef1 function restores polarized growth to scd1low tea1Δ cells. (A) Movie timepoints showing cell morphology and mCherry-Bgs4 distribution in the indicated genotypes. scd1 expression was repressed 24 h before imaging. 3-BrB-PP1 was added 30 min before imaging. Diagrams show outlines at the beginning and end of movies. Note that newborn daughter cells often have less mCherry-Bgs4 at cell tips. (B) Quantification of mCherry-Bgs4 at cell tips, from movies of the type in Figs 3 and 4A; ‘n’ indicates the number of cells scored. Pairwise differences relative to control (first column) were highly significant for all strains except gef1Δ, (P<0.0001; Fisher's exact test, with correction for multiple comparisons). Scale bar: 10 µm. See also Fig. S3 and Movie 4.

