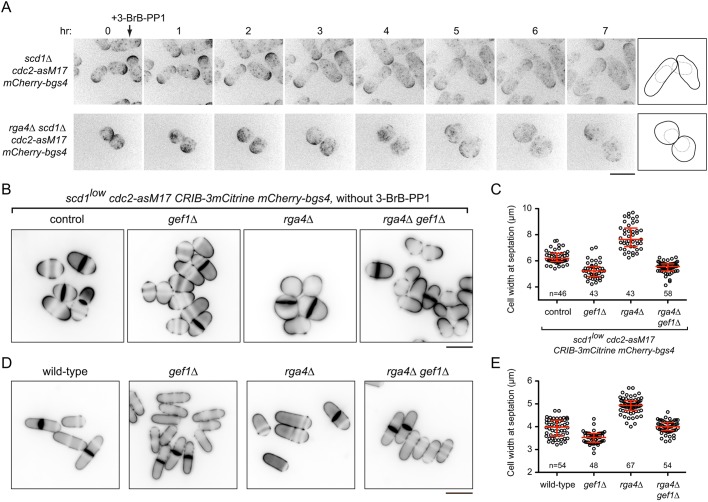
Fig. 7.
scd1Δ rga4Δ cells show PORTLI growth, and gef1Δ rescues the short/wide-cell phenotypes associated with rga4Δ. (A) Movie timepoints showing cell morphology and mCherry-Bgs4 distribution in the indicated genotypes after 3-BrB-PP1 treatment (added just after the 0 h timepoint). Diagrams show outlines at the beginning and end of movies. Outlines are more obvious in movies (Movie 9). (B) Calcofluor staining of actively cycling cells for the indicated genotypes. scd1 expression was repressed 24 h before imaging. Although cdc2-asM17 is present, 3-BrB-PP1 was not added to cultures. (C) Cell width at septation for the genotypes in B. Median and interquartile ranges are shown. All pairwise comparisons were highly significant (Mann–Whitney test; P<0.0001 for all except gef1Δ versus rga4Δ gef1Δ, for which P=0.004). ‘n’ indicates the number of cells scored. (D) Calcofluor staining of actively cycling wild-type cells and mutants indicated, in wild-type background. (E) Cell width at septation for the genotypes in D. Median and interquartile ranges are shown. All pairwise comparisons were highly significant (Mann–Whitney test; P<0.0001), except wild-type versus rga4Δ gef1Δ (P=0.57). Scale bars: 10 μm. See also Fig. S8 and Movie 9.

