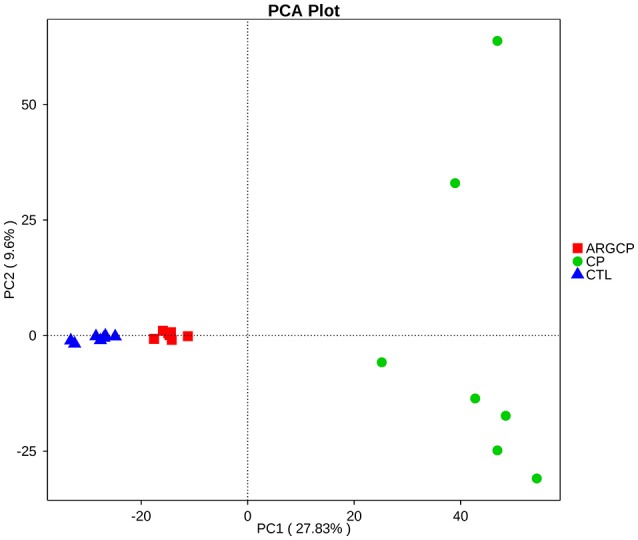
Figure 2.

Comparison of the compositions of the ileal microbiota by principal component analysis (PCA). CTL, non-challenge control; CP, C. perfringens-challenged group; ARGCP, C. perfringens-challenged group fed diet supplemented with 0.3% l-arginine.
