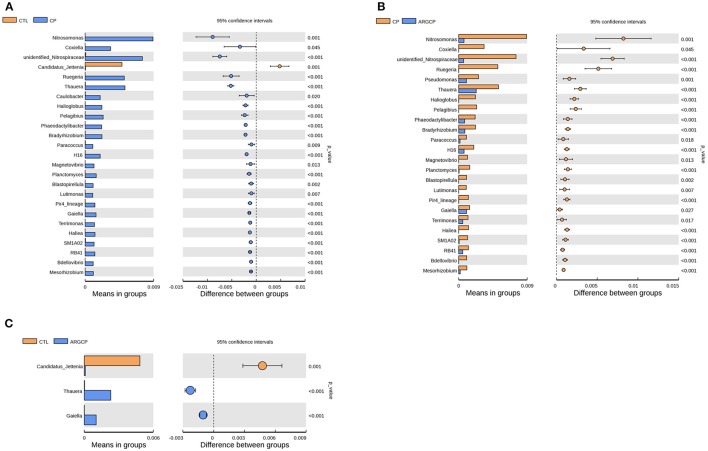
Figure 3.
The genera differentially abundant between three treatments in the ileum by t-test analysis. These figures illustrate the differences in the microbiota in terms of the relative abundances of genera between groups CTL and CP (A), groups CP and ARGCP (B), and groups CTL and ARGCP (C). Only data whose differences with P-values lower than 0.05 and the relative abundances higher than 0.1% in either of the pairs are shown. CTL, non-challenge control; CP, C. perfringens-challenged group; ARGCP, C. perfringens-challenged group fed diet supplemented with 0.3% l-arginine.

