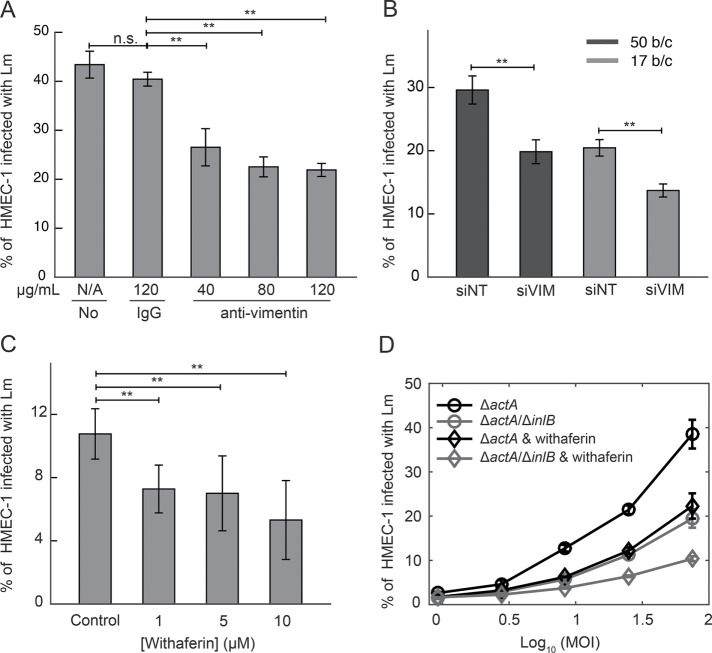
FIGURE 7:
Surface vimentin of HMEC-1 is implicated in Lm uptake. (A) Decrease in bacterial uptake after blocking HMEC-1 with anti-vimentin antibody H-84. Barplots of percentage of HMEC-1 infected with ΔactA Lm (actAp::mTagRFP) as a function of antibody concentration (means ± SD and N = 6 replicates per experiment). Representative data come from one of three independent experiments. Infection was analyzed by flow cytometry, 7–8 h after infection. (B) Barplots of percentage of HMEC-1 infected with ΔactA Lm (actAp::mTagRFP) for cells treated either with nontargeting siRNA (siNT) or with vimentin siRNA (siVIM) (means ± SD, and N = 6 replicates per experiment). Representative data come from one of three independent experiments. MOI is 50 (black barplots) and 17 (gray barplots). (C) Decreased uptake of Lm when HMEC-1 are treated with withaferin that captures soluble vimentin 30 min prior to infection. Barplots of percentage of HMEC-1 infected with ΔactA Lm (actAp::mTagRFP) as a function of withaferin concentration (means ± SD and N = 6 replicates per experiment). Representative data come from one of three independent experiments. Infection was analyzed by flow cytometry 7–8 h after infection. (D) Percentage of HMEC-1 infected with Lm as a function of the logarithm of MOI (mean ± SD, N = 4 replicates). HMEC-1 were infected with the indicated strains: ΔactA (black), ΔactA/ΔinlB (gray; actAp::mTagRFP), and HMEC-1 were treated with vehicle control (circle) or withaferin (diamond) for 30 min prior to infection. The frequency of infected HMEC-1 was determined by flow cytometry 7–8 h postinfection. Representative data come from one of three independent experiments. MOI ranged from 50 to120. Two asterisks denote statistically significant differences between the medians of infection fraction of control vs. all other groups (p < 0.01; Wilcoxon rank-sum test).

