FIGURE 2:
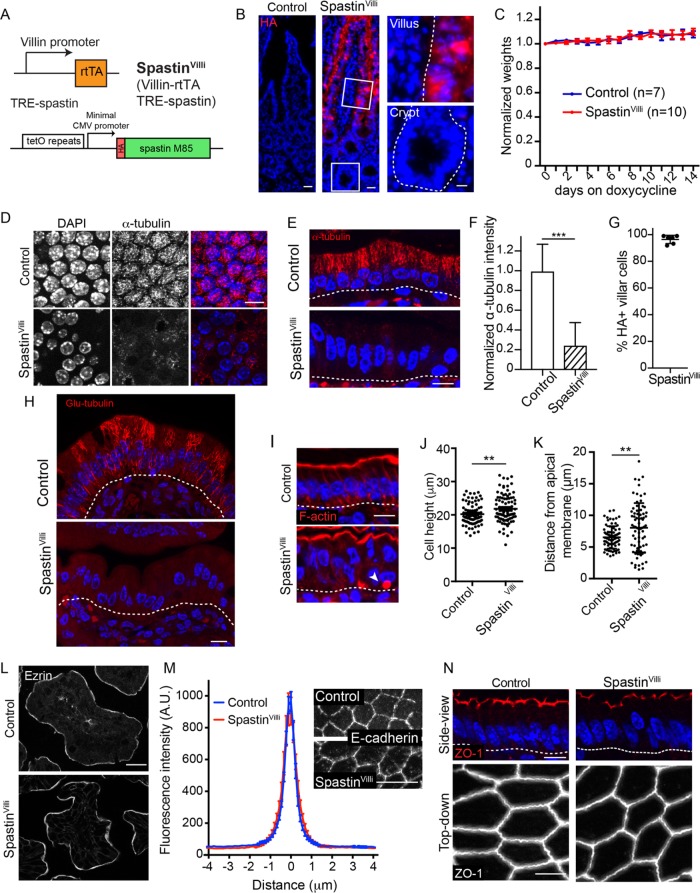
Effects of microtubule disruption in enterocytes. (A) Alleles used to generate SpastinVilli mice. (B) HA-spastin expression after 48 h of doxycycline administration. Scale = 25 µm. Zoomed regions show HA-spastin expression in the crypt and villus. Scale = 10 µm. (C) Weights of control and SpastinVilli mice on doxycycline-containing diet. Error bars show SD. (D, E) Microtubule organization in control and SpastinVilli mice following doxycycline administration. Scale = 10 µm. (D) Top-down view. (E) Side view. (F) Quantification of α-tubulin intensity in control and SpastinVilli cells. n = 30 cells from each of two mice for each genotype. Error bars show SD. (G) Quantification of HA-positive villar cells in SpastinVilli mice. Six mice were examined, >190 cells/mouse. Error bars show SD. (H) Glu-tubulin staining in control and SpastinVilli intestines. Scale = 10 µm. (I) Cross-section view of cell morphology upon spastin overexpression. White arrow indicates an inclusion body. Scale = 10 µm. (J) Quantification of cell heights in control and SpastinVilli mice. n = 90 cells for each genotype. (K) Quantification of nuclear position in control and SpastinVilli mice. n = 75 cells for each genotype. (L) Ezrin localization in control and SpastinVilli mice. Scale = 20 µm. (M) Images and line scans of E-cadherin in control and SpastinVilli mice. n = 48 junctions for each genotype. Scale = 10 µm. (N) ZO-1 localization in cross-sectional or top-down view in control and SpastinVilli mice. Scale = 10 µm (top), 5 µm (bottom). **, p < 0.01; ***, p < 0.001.

