FIGURE 3:
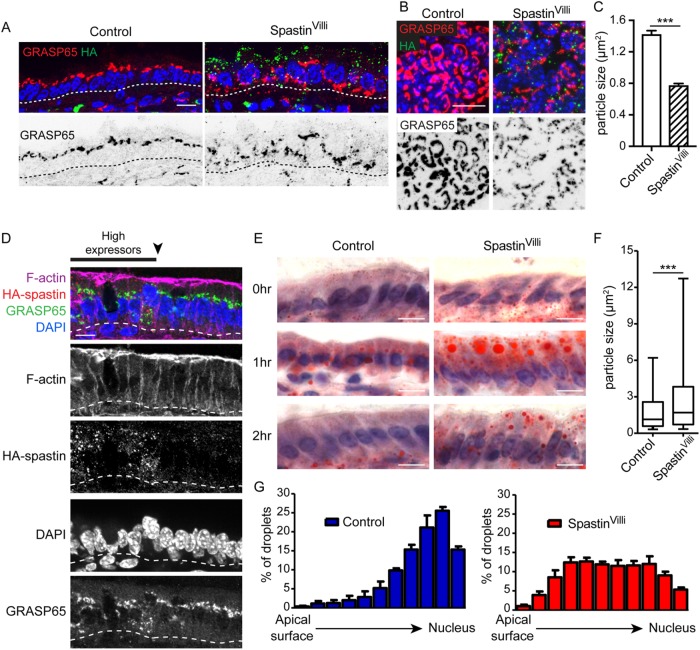
Microtubule disruption perturbs intracellular trafficking in the intestinal epithelium. (A) Cross-sectional view of GRASP65 localization in control or SpastinVilli villar cells. Scale = 10 µm. (B) Top-down view of Golgi fragmentation in control and SpastinVilli villi. Scale = 10 µm. (C) Quantification of Golgi particle size in control and SpastinVilli mice. n = 3 mice for each genotype (2130 and 2899 particles for control and SpastinVilli mice, respectively). (D) Golgi and nuclear positioning defects are cell-autonomous in the SpastinVilli intestine. Scale = 10 µm. (E) Oil Red O staining of intestinal sections at indicated times following oil gavage. Scale = 10 µm. (F) Quantification of Oil Red O particle size in control and SpastinVilli mice 1 h after oil gavage. n = 3 mice per genotype. Whiskers are the 5th to 95th percentile. (G) Quantification of lipid droplet intracellular placement in control and SpastinVilli mice 1 h after oil gavage. n > 650 lipid droplets for each genotype. ***, p < 0.001.

