FIGURE 5:
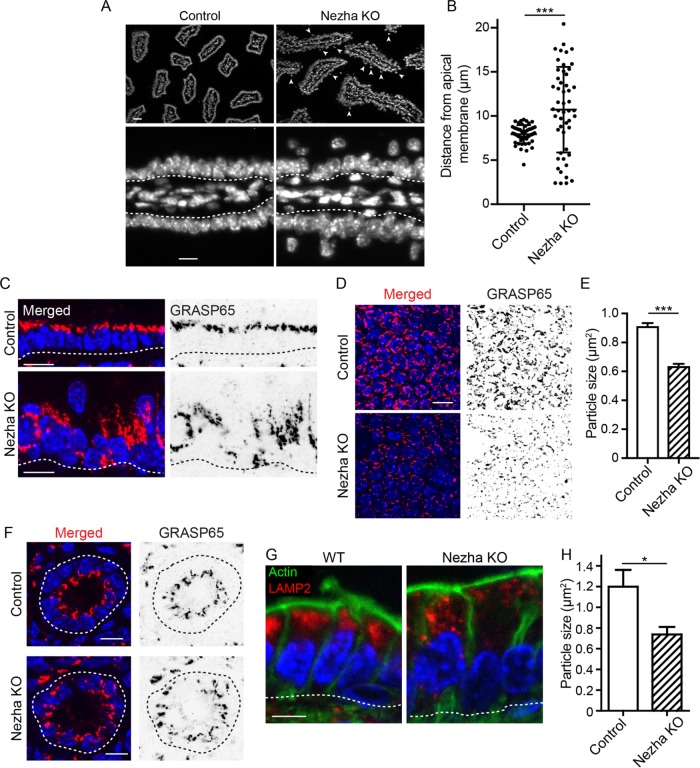
Organelle disorganization in the epithelium of the Nezha KO mouse. (A) Nuclear position in control and Nezha KO intestinal epithelia. Scale = 25 µm (top), 10 µm (bottom). (B) Quantification of nuclear position in control and Nezha KO cells. n = 50 and 51 cells for control and SpastinVilli mice, respectively. Error bars show SD. (C) Cross-section view of GRASP65 localization in control and Nezha KO villar cells. Scale = 10 µm. (D) Top-down view of GRASP65 fragmentation in control and Nezha KO villar cells. Scale = 10 µm. (E) Quantification of Golgi particle size in control and Nezha KO villar cells. n = 3 mice for each genotype (2319 and 1213 total particles for control and Nezha KO mice, respectively). (F) GRASP65 localization in control and Nezha KO crypts. Scale = 10 µm. (G) LAMP2 localization in control and Nezha KO villi. Scale = 5 µm. (H) Quantification of LAMP2 particle size in control and Nezha KO cells. n = 3 mice for each genotype (one value for each mouse was calculated by averaging between 289 and 2159 particles per mouse). *, p < 0.05; ***, p < 0.001.

