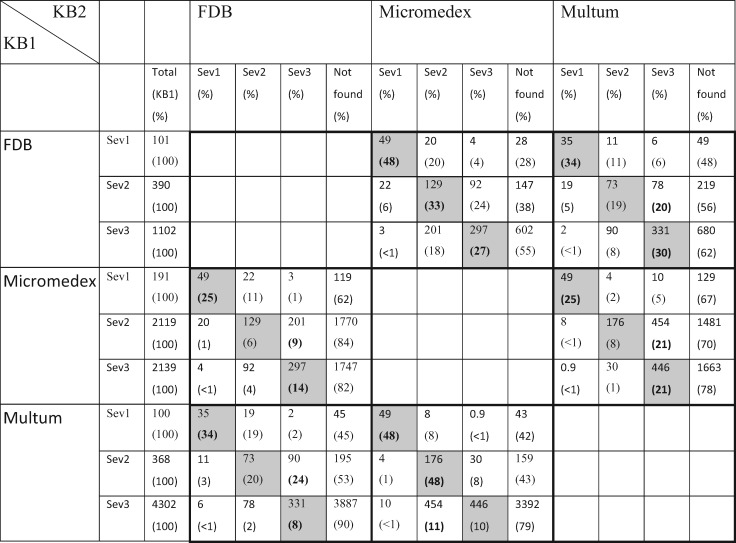
Table 2.
Pairwise comparison showing number of overlapping clinical drug pairs (numbers in thousands) between KBs
 |
Each pairwise comparison is outlined by thick borders. The percentages are based on row totals (KB1). The highest percentage (excluding “not found”) in each severity category is highlighted in bold type. Shaded boxes are those in which the severity rankings in 2 KBs agree (sev1 = contraindicated, sev2 = major/severe, sev3 = moderate).
