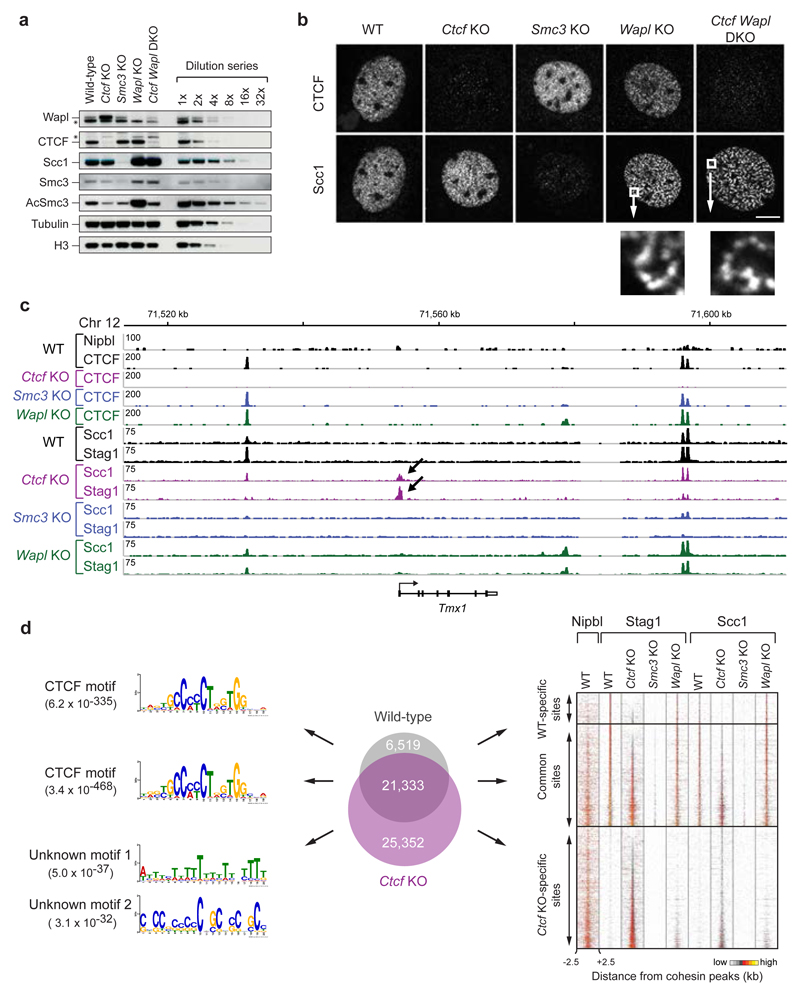
Figure 1. Cohesin distribution in wild-type, Ctcf, Smc3 and Wapl knockout MEFs.
a, Immunoblot analysis of whole cell extracts of quiescent knockout MEFs including dilution series of wild-type sample. b, Fluorescence microscopy with Scc1 and CTCF antibodies. Size bar, 10 μm. Below: higher magnification of Scc1 staining. c, Binding of CTCF, Nipbl, Stag1 and Scc1 at the Tmx1 locus, as determined by ChIP-seq. d, Analysis of cohesin-binding site distribution in wild-type and Ctcf KO cells (Venn diagram). Left: DNA-binding motif prediction with indicated E-value. Right: heat maps of cohesin and Nipbl binding in different KO cells (sorted according to Stag1 binding in Ctcf KO cells).

