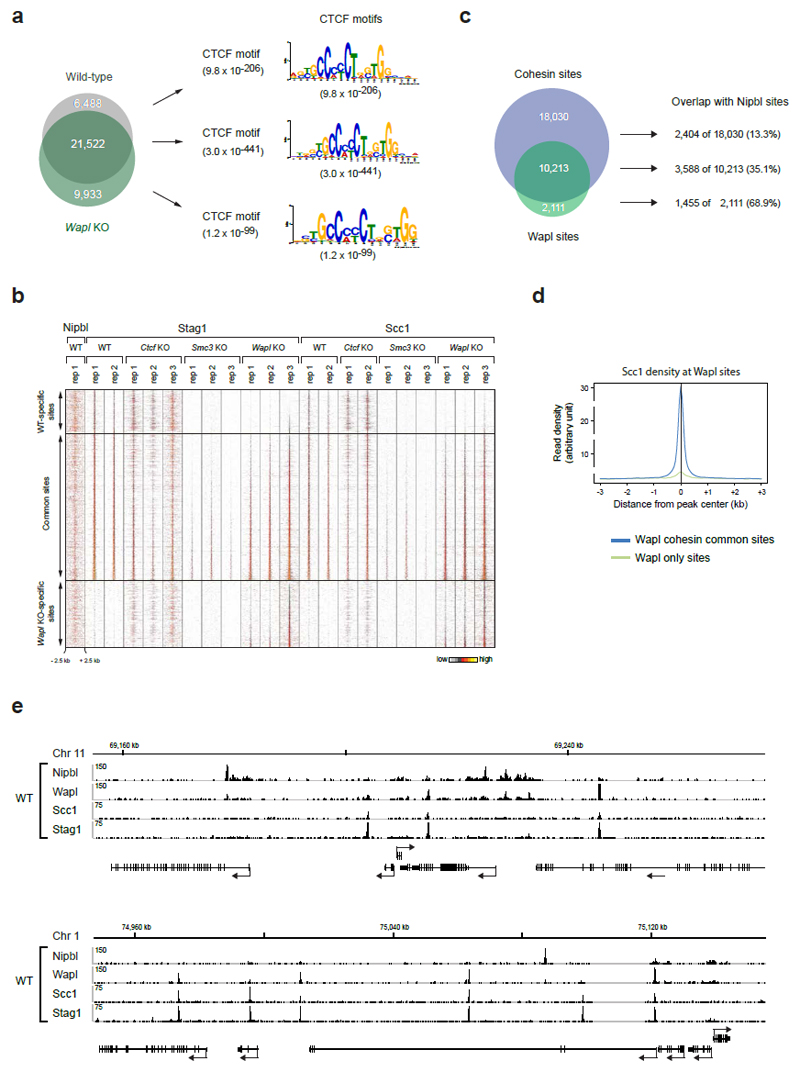
Extended Data Figure 6. Genomic localization of cohesin in Wapl KO cells.
a. The cohesin-binding sites detected in wild-type and Wapl KO cells were subdivided into WT-specific, Wapl KO-specific and common peaks, as indicated by the Venn diagram. For each subgroup, the most significant DNA-binding motif is shown. The different motifs were detected with the E-value indicated in brackets. b. Heat maps of Nipbl and cohesin binding for the different subgroups. Cohesin peaks were blotted on the vertical axis for a region extending from -2.5 kb to +2.5 kb relative to the cohesin peak summit (horizontal axis) and were sorted in each subgroup according to the density of Stag1 binding in Wapl KO cells (replica 3). A density scale from low (grey) to high (yellow) is shown. c, Venn diagram of Wapl and cohesin peaks in WT MEFs. The individual subgroups were further overlapped with Nipbl sites. d, Density profiles of Scc1 binding are shown for Wapl only sites (green) and cohesin/Wapl common sites (blue). Note that cohesin is also enriched (even though at low level, which is not detected by the peak calling algorithm we used) at "Wapl only" sites, consistent with our observation that the association of Wapl with chromatin depends on cohesin49 and Extended Data 1f). e, Examples of the distribution of Nipbl, Wapl, and cohesin (Stag1 and Scc1) at two genomic regions, one on chromosome 11 and the other on chromosome 1, as determined by ChIP-seq analysis in WT MEFs.

