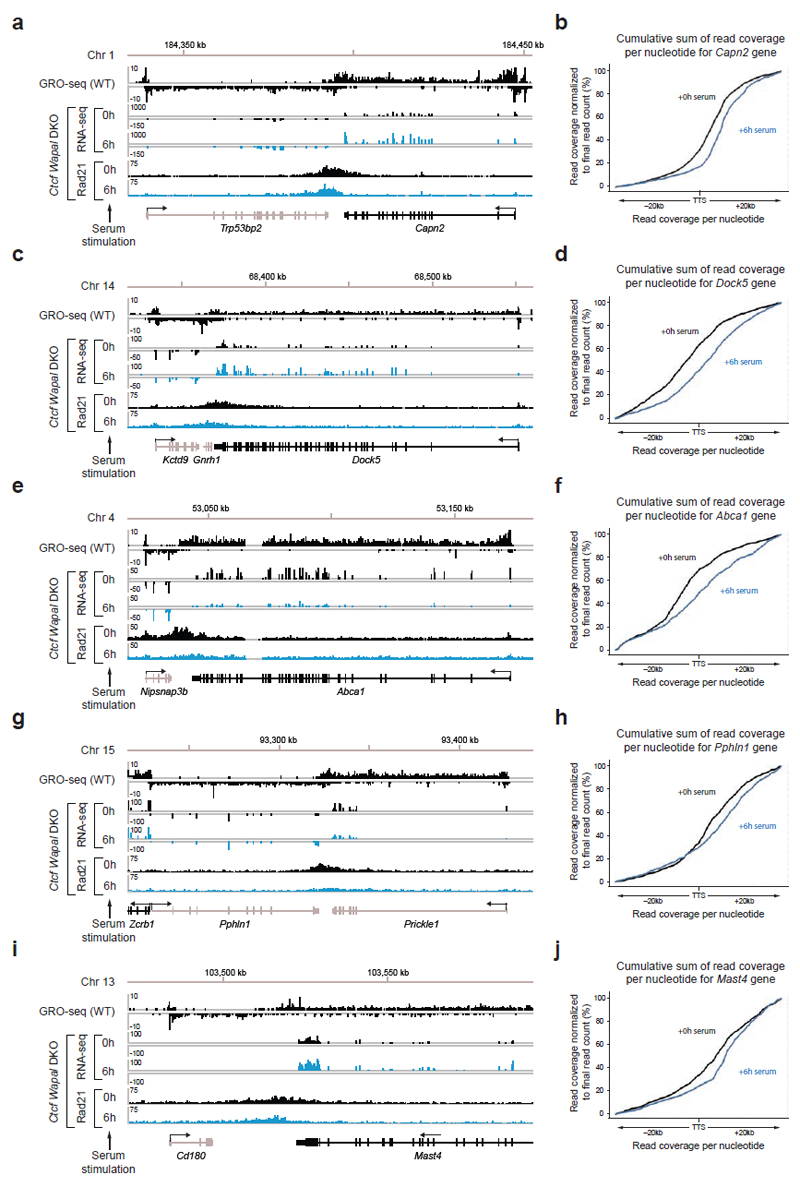
Extended Data Figure 9. Transcriptional changes induced by serum stimulation affect positioning of cohesin islands.
a,c,e,g,i. Binding of Scc1 and mRNA profiling upon serum stimulation (20% fetal bovine serum) at five genomic regions. The observed differences in cohesin island positioning correlate with increased or decreased mRNA levels of the respective genes as measured by their RPKM value (a, Capn2: 104.88 → 248.32; c, Dock5: 4.89 → 14.06; e, Abca1: 11.51 → 2.27; g, Pphln1: 5.13 → 8.00 and Prickle1: 14.19 → 7.86; i, Mast4: 7.70 →16.68). b,d,f.h,j Visualization of the altered shape of cohesin islands by plotting the cumulative sum of reads per nucleotide starting from -20 kb to + 20 kb after the transcription termination sites of Capn2 (b), Dock5 (d), Abca1 (f), Pphln1 (h) and Mast4 (j) gene (see Online Methods).

