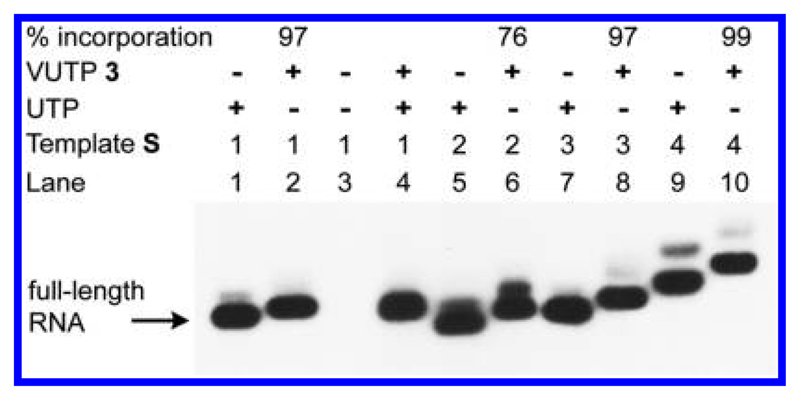
Figure 3.
Phosphor image of transcripts obtained by transcription of templates S1−S4 in the presence of UTP and 3. “The percent of incorporation of 3 is reported relative to a control transcription with UTP. For a complete gel picture, see Figure S1.

