FIGURE 3:
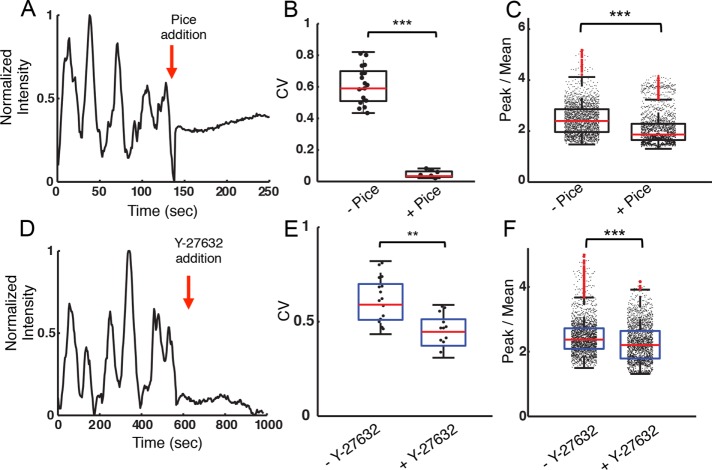
Actin fluorescence intensity oscillations are dependent on BCR signaling and are driven by myosin. (A) Actin fluorescence intensity within a representative ROI in an EGFP-actin A20 cell activated on a ridged surface with 3-μm spacing before and after the addition of piceatannol. The red arrow indicates the time of inhibitor addition. (B) CV for fluorescence intensity traces before and after piceatannol addition (N = 21, N = 12 cells, respectively, p < 0.001 KS test). The CV was measured in a 6-min interval both before and after inhibitor addition. (C) Peak-to-mean ratio of actin fluorescence intensity for cells on ridges with 3- and 5-µm spacing before and after piceatannol addition (p << 0.001 KS test, N = 10 cells). (D) Integrated actin fluorescence intensity of an ROI in a representative EGFP-actin A20 cell activated on a ridged surface with 3-μm spacing before and after Y-27632 addition. (E) Coefficient of variation for fluorescence intensity traces before and after Y-27632 addition (N = 21, N = 17, respectively, p < 0.01 KS test). The CV was measured in 6-min intervals both before and after inhibitor addition. (F) Peak-to-mean ratio of actin fluorescence intensity for cells on ridges with 3- and 5-µm spacings before and after Y-27632 addition (p < 0.001 KS test, N = 13 cells)

