
FIGURE 5:
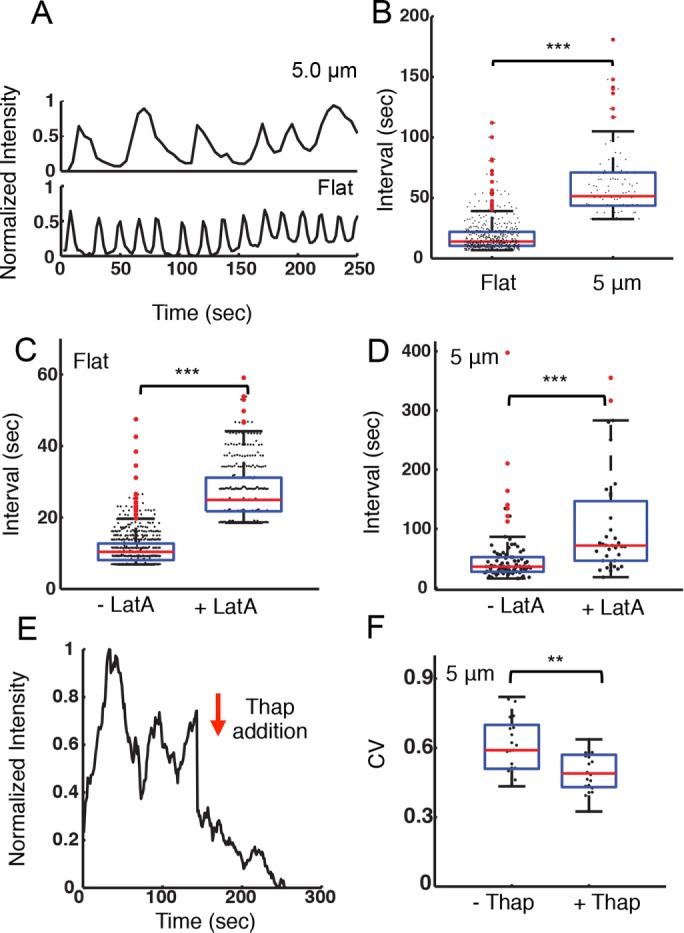
Nanotopography influences intracellular calcium signaling. (A) Integrated, whole-cell fluorescence intensity of the calcium-sensitive dye OGB-1 for representative A20 cells on flat surfaces and on ridges with a 5-μm spacing. (B) Distribution of peak-to-peak intervals between adjacent oscillations in OGB-1 fluorescence intensity for A20 cells on flat substrates (N = 27) and on ridges with a 5-μm spacing (N = 17). The average interval is significantly different for the two substrates (p << 0.001 KS test). (C) Distribution of peak-to-peak intervals between adjacent oscillations in OGB-1 fluorescence intensity for cells on a flat substrate before (–LatA, N = 27) and after (+LatA, N = 20) addition of 100 nM latrunculin-A (p << 0.001 KS test). (D) Distribution of peak-to-peak intervals between adjacent oscillations in OGB-1 fluorescence intensity for cells on ridges with a 5-μm spacing before (–LatA, N = 14) and after (+LatA, N = 12) addition of 100 nM latrunculin-A (p << 0.001 KS test). (E) Representative time dependence of the integrated actin fluorescence intensity within an ROI of an EGFP-actin A20 cell before and after 1 µM thapsigargin addition on ridges with a 5-μm spacing. The arrow indicates the time of the addition. (F) Coefficient of variation for integrated EGFP-actin intensity in ROIs as described previously, before (–Thap) and after (+Thap) the addition of 1 µM thapsigargin (N = 21, N = 20, respectively, p < 0.01 KS test).