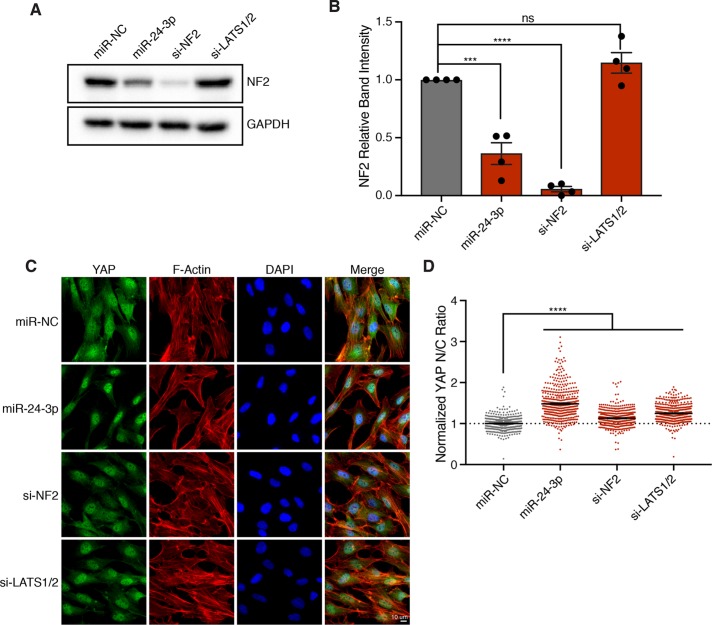
FIGURE 4:
miR-24 activates YAP through down-regulation of NF2. (A) Representative Western blot of NF2 protein levels in RPE-1 cells transfected with the indicated siRNA/miRNA after 48 h. (B) Quantification of Western blots in A. Error bars represent mean ± SEM (n > 3, ***p ≤ .001, ****p ≤ .0001, ns = nonsignificant, one-way ANOVA). (C) Representative fixed images of YAP localization in RPE-1 cells transfected with the indicated siRNA/miRNA after 48 h (n > 3). (D) Plot depicts the normalized ratio of YAP immunofluorescence intensity in the nucleus:cytoplasm (N/C) from C (n > 450 cells/condition, ****p ≤ .0001, one-way ANOVA).

