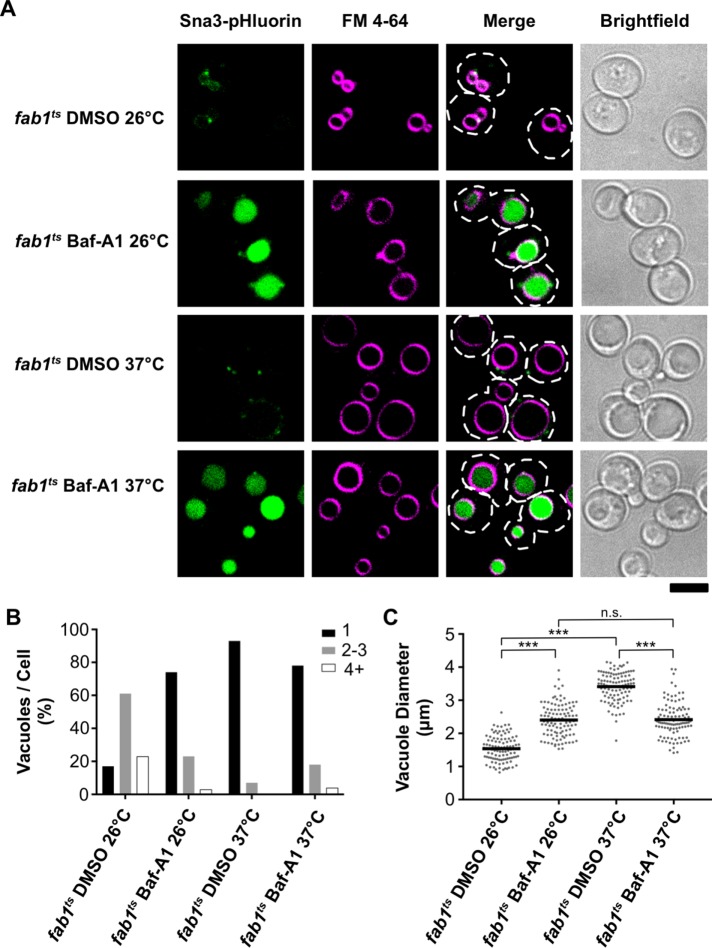
FIGURE 4:
Acute inhibition of vacuole acidification blocks vacuole enlargement in fab1ts cells. (A) Live-cell confocal fluorescence microscopy analysis of the vacuole morphology and Sna3-pHluorin fluorescence in fab1ts cells. Images were taken after a 2-h incubation at the indicated temperature and treated with either vehicle (DMSO) or 10 µM bafilomycin-A1 (Baf-A1). The vacuole membrane is stained with FM 4-64. Dashed lines represent cell outlines. Scale bar = 4 µm. (B) Quantitation of the number of vacuoles observed per cell in fab1ts for the conditions imaged in A by counting FM 4-64–labeled organelles (n > 100 cells per strain). (C) Quantitation of vacuole diameter measurements taken by a line-scan analysis of FM 4-64–labeled vacuoles. Diameters were measured for only the largest vacuole observed per cell. Each dot represents a single vacuole, with the horizontal line representing the mean of all measurements (n = 104 per strain). Unpaired t tests with Welch’s correction were used to determine statistical significance; n.s., not significant; ***, P < 0.001.

