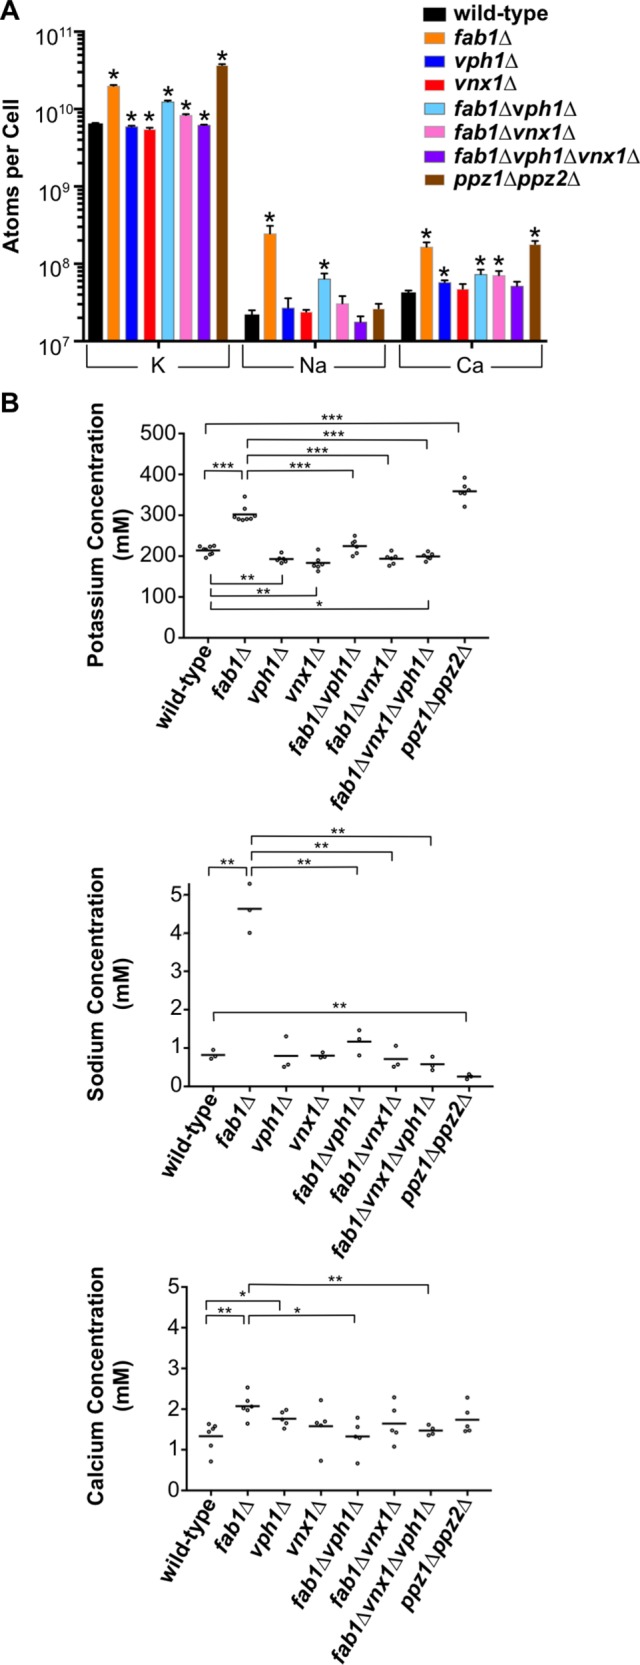
FIGURE 5:

Cation content is increased in fab1∆ yeast. (A) Quantitation of the total K, Na, and Ca molecules observed per cell for each of the strains indicated, as determined by ICP-AES. The bars represent the mean, error bars show the SD of three or more independent experiments and unpaired t tests with Welch’s correction were used to determine statistical significance; *, P < 0.05. Unless otherwise indicated, all other mutant strains were not statistically different compared with the wild-type control. Supplemental Figure 5A provides the same values on a linear scale. (B) Concentrations for each of the elements analyzed in A for the yeast strains indicated. Each dot represents the mean of a single analysis with two technical replicates, while the horizontal line denotes the mean of three or more independent experimental replicates. Unpaired t tests with Welch’s correction were used to determine statistical significance; *, P < 0.05; **, P < 0.01; and ***, P < 0.001. Unless otherwise indicated, all other mutant strains were not statistically different compared with the wild-type control.
