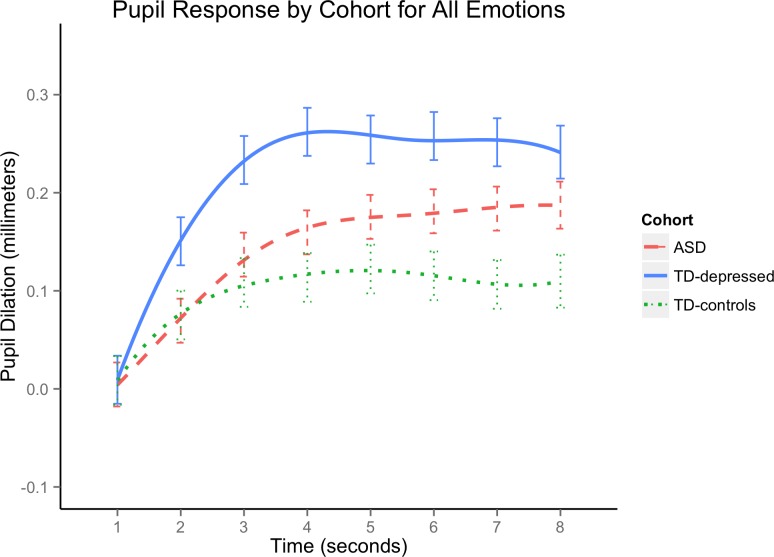
Fig 3. Pupil Response by Cohort for All Emotions.
The x-axis represents the 8 second viewing of the scrambled mask (see Fig 1) following emotional face stimuli presentation. ASD = adults with autism spectrum disorder; TD-depressed = typically developing adults with current depressive disorders; TD-controls = typically developing comparison adults with no history of depression or anxiety. Because the functions appeared smooth, we generated plots using cubic splines with two knots. Significant differences tested at seconds 1 through 8 at Bonferroni-adjusted α = .05/8 = 0.00625 were: TD-controls<TD-depressed at seconds 2 through 8; ASD<TD-depressed at seconds 2 through 6, and TD-controls<ASD at seconds 6 through 8 (see Table 2 for details).

