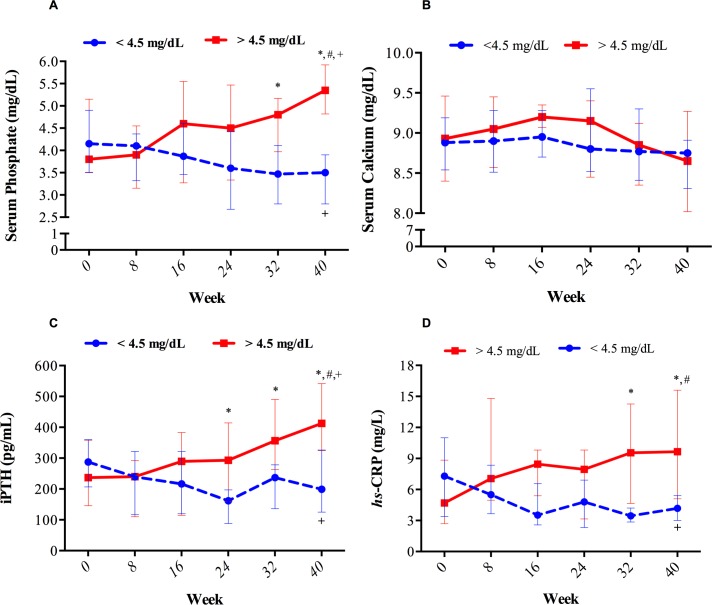
Fig 2. Change in parameters of mineral metabolism throughout the 40 weeks of follow-up in patients that completed the study with serum phosphate concentration above or below 4.5 mg/dL.
In the group of patients with a final serum P<4.5 mg/dL, 54, 80, 80, 80, 100 and 100% of them had a ranged serum phosphate below the target at week 0, 8, 16, 24, 32 and 40 respectively. On the contrary, in the group with a final serum phosphate >4.5 mg/dl, 66, 77, 44, 44, 33 and 0% of the patients had serum phosphate levels below the study target along the study period. Dots represent median and whiskers represent IQR. * Between-group differences P<0.05. + Within-group differences P<0.05 for different groups. # P<0.001 for global comparison of curves.

