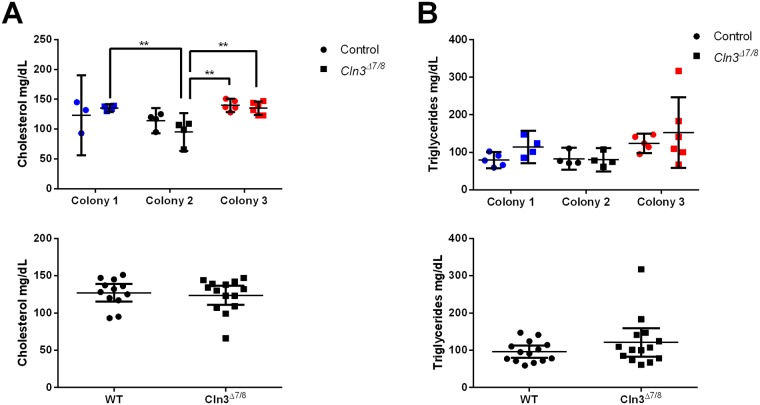
Fig 2. Colony specific effects on lipid levels in Cln3Δex7/8 and wild-type animals at 5 months of age.
Cholesterol and triglyceride levels were analyzed for colonies 1 (blue, Sanford Research), 2 (black, University of Nebraska Medical Center), and 3 (red, Rosalind Franklin University of Medicine and Science) for both control (circle) and Cln3Δex7/8 mice (square). Graphs indicate concentration of cholesterol (A) and triglycerides (B), with individual colony data on top and pooled colony data on the bottom. There was a significant effect of the animal’s housing colony of measured cholesterol levels (p = 0.0003, A), and triglyceride levels (p-0.0344, B) Data represented as mean ± 95% CI; data points represent individual mice at indicated colony location. Statistical significance for top graphs was determined using ordinary two-way ANOVA, followed by Tukey’s multiple comparison test with a Bonferroni correction. Statistical significance for bottom, pooled colony graphs was determined using an unpaired student’s t test. **p<0.01.

