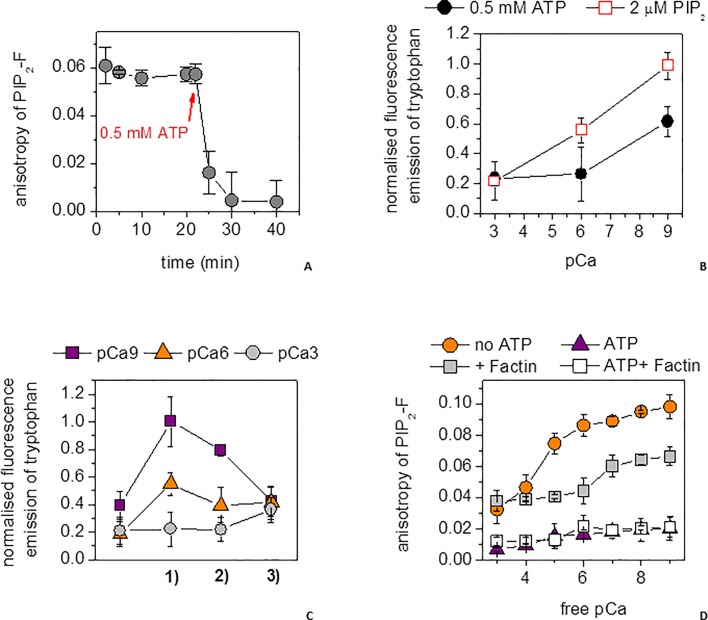
Fig 2. PIP2 binding to gelsolin under actin polymerizing conditions.
(a) The anisotropy of PIP2-F (0.25 μM) was measured as a function of time in the presence of 5 μM gelsolin, 10 μM Ca2+(pCa 5), 1 mM Mg2+ (pMg 3) and 50 mM K+ (gray circles). After 20 min, ATP (0.5 mM) was added. (b) Tryptophan fluorescence emission of gelsolin (5 μM) was measured at steady-state at three free-calcium concentrations: 1 nM (pCa 9), 1 μM (pCa 6) and 1 mM (pCa 3) in the presence of 2 μM PIP2 (red open squares) or 0.5 mM ATP (filled black circles). (c) Tryptophan fluorescence emission of gelsolin (5 μM) was measured at steady-state at three free-calcium concentrations: 1 nM (pCa 9, purple squares), 1 μM (pCa 6, orange triangles) and 1 mM (pCa 3, gray circles) through a cycle of 1) 2 μM PIP2 addition, 2) 0.5 mM ATP addition and 3) calcium levels set to 1 μM (pCa 6). (d) The steady-state anisotropy of PIP2-F (0.25 μM) in the presence of gelsolin (5 μM) under actin polymerizing salt conditions (1 mM Mg2+ (pMg 3), 100 mM K+, orange circles) followed a similar profile to that without salt across a wide range of calcium ion concentrations (see data presented on Fig 1D). Addition of F-actin (50 μM, gray squares) reduced the anisotropy, but still indicated significant binding. Inclusion of ATP (0.5 mM) reduced the anisotropy close to background levels, to the value characteristic to free PIP2-F both in the presence (white squares) and absence (purple triangles) of F-actin (50 μM) indicating the dissociation of the gelsolin/PIP2-F complex across the entire calcium concentration range.

