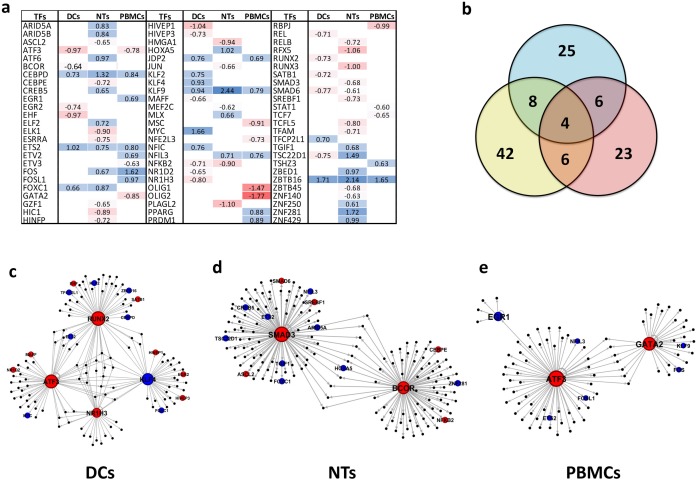
Fig 5. TFs and GRN analysis.
a) Detected TFs in all cell types and their expression status. Blank spaces mean no expression alteration was observed for the TFs. b) Venn diagram of common TFs among cell types. c) GRN of DCs, d) GRN of NTs, and f) GRN of PBMCs. Blue colors mean up-regulation and red mean down-regulation. Abbreviations: TFs: Transcription Factors; GRN: Gene Regulatory Networks; DCs: Dendritic Cells; NTs: Neutrophils; PBMCs: Peripheral Blood Mononuclear Cells.

