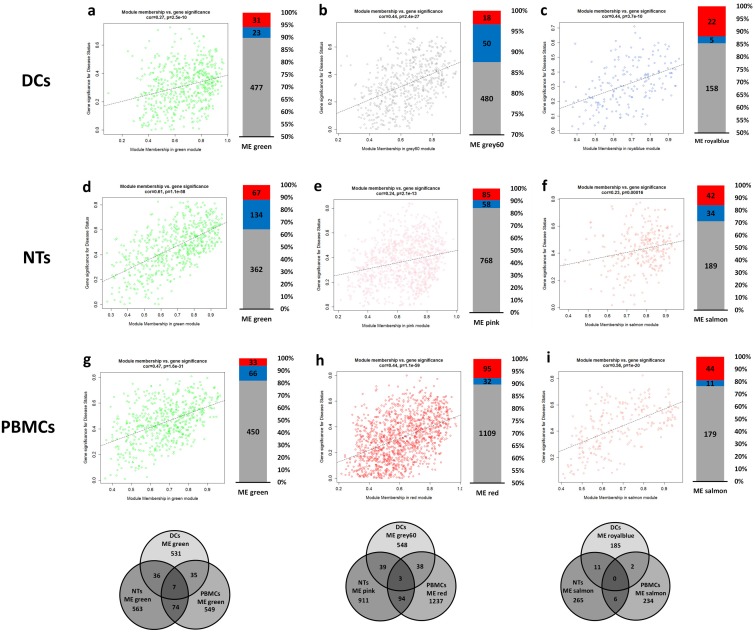
Fig 8. Correlation of module memberships versus gene significance for disease status.
Scatterplot graphs show the correlation of module memberships of the genes in each module versus significance of the genes for the disease status. Additionally, expression status of the module members was considered and shown in the form of single bar graphs on the right of counterpart scatterplot graphs. Red and blue colors mean down- and up-regulation. Finally, common genes among the modules were presented in Venn diagram graphs below the related scatterplots of all cell types. No common genes were detected among modules of a cell type. a, b, c) modules of DCs. d, e, f) modules of NTs. g, h, i) modules of PBMCs. Abbreviations: DEGs: Differentially Expressed Genes; DCs: Dendritic Cells; NTs: Neutrophils; PBMCs: Peripheral Blood Mononuclear Cells.

