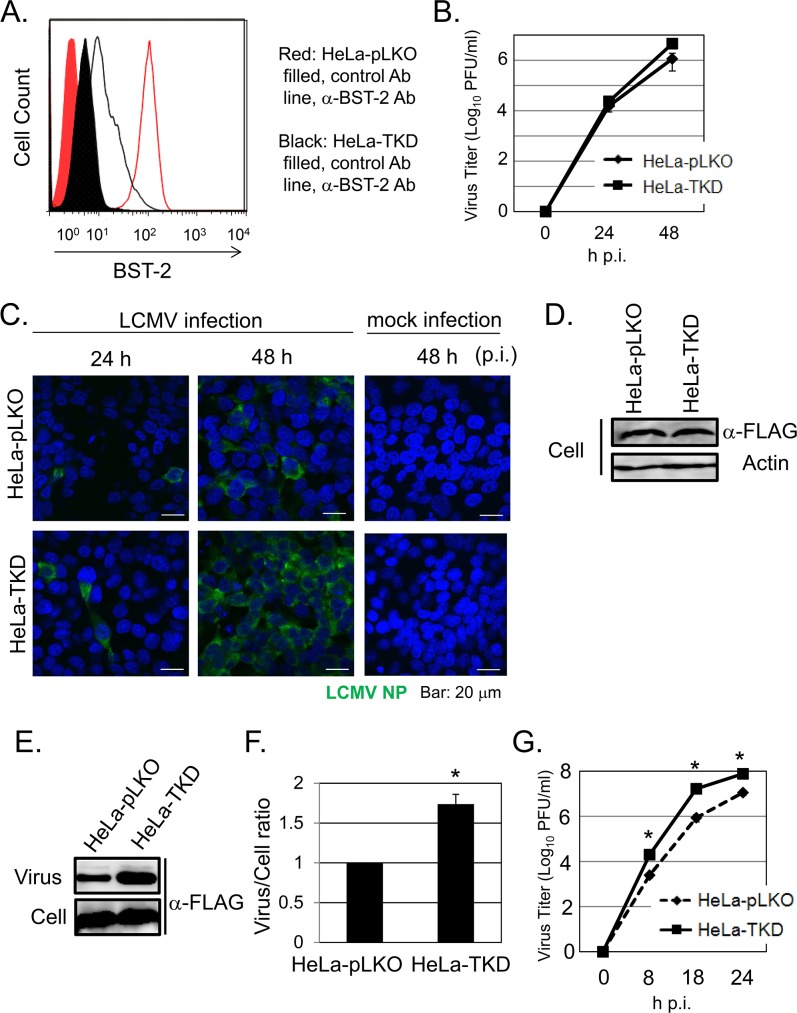
Fig 1. Endogenous BST-2 expression levels have a very limited impact on LCMV propagation in vitro.
A. Cell surface expression of BST-2 in HeLa-TKD and HeLa-pLKO cells. Cells were fixed and analyzed by FACS using either a control antibody (Ab) or anti-BST-2 conjugated to PE. B. Growth kinetics of LCMV in HeLa-pLKO and HeLa–TKD cells. Cells were infected with LCMV (moi = 0.01). At 24 and 48 hrs p.i, virus titers in TCS were determined by plaque assay (n = 3; 2 independent experiments). C. Propagation of LCMV in HeLa-pLKO and HeLa-TKD cells. Cells were infected with LCMV (moi = 0.1). At 24 and 48 h p.i., cells were fixed with 4% PFA and after permeabilization stained with a MAb to LCMV NP, followed with a second antibody conjugated to FITC. Nuclei were stained with DAPI. Mock infected cells were used as control. D.Similar Z protein expression levels in HeLa-TKD and HeLa-pLKO cells at 16 h p.i. Cells were infected (moi = 0.1) with rLCMV/Z-FLAG and at 16 h p.i. expression levels of Z protein determined by WB using a MAb to FLAG. Levels of actin were used as loading control. E-F. Production of virion particles by LCMV-infected HeLa-TKD and HeLa-pLKO cells. Cells were infected with rLCMV/Z-FLAG (moi = 0.1) and at 24 hrs p.i. virion particles present in TCS were recovered by ultracentrifugation, and cell lysates prepared. Levels of Z protein present in virion particle preps and cell lysates were determined by WB using an Ab to FLAG (E), and signals quantified with LAS3000 (Fuji Film) (F). The ratio of virus/cell Z protein levels in HeLa-pLKO was set to 1.0 (n = 3; 3 independent experiments). G. Growth kinetics of VSV in HeLa-pLKO and HeLa–TKD cells. Cells were infected with VSV (moi = 0.01). At 8, 18 and 24 h p.i, virus titers in TCS were determined by plaque assay (n = 3; 2 independent experiments). Data correspond to mean + SD. Asterisks (*) denote statistical significance (P < 0.05).

