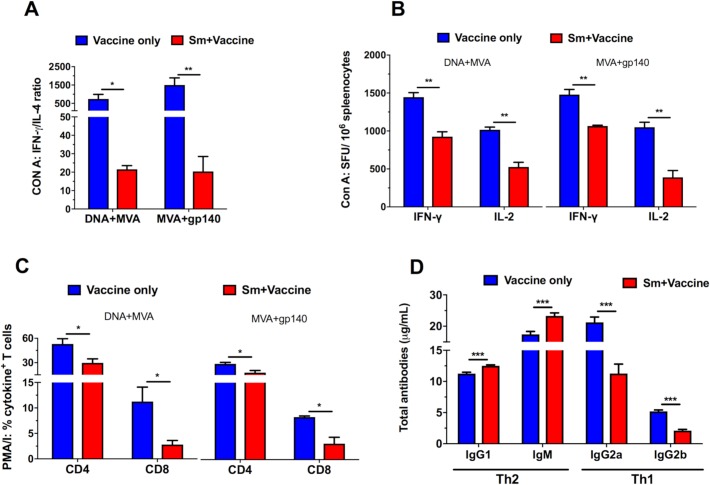
Fig 1. Th1/Th2 profile: S. mansoni infection induces a strong Th2 biased cellular and antibody responses.
Spleens and blood were obtained from vaccinated Sm-free (blue) and Sm-infected (red) mice 16 weeks post infection. Splenocytes were prepared and stimulated with 1 μg/ml Con A for 48 (A) and 23 (B) hours and cytokines were measured in cytometric bead array and ELISpot assays respectively. Other splenocytes were stimulated with PMA/Ionomycin for 6hrs (C) and the induced intracellular cytokines were measured by flow cytometry. Total Th1 and Th2 antibodies were also measured in sera using an antibody ELISA (D). Results represent 3 independent experiments and plotted as the mean + SEM. Statistical analysis was performed using unpaired, two-tailed t-test analysis followed by FDR for multiple comparisons. (*: p<0.05; **: p<0.01; ***: p<0.001).

