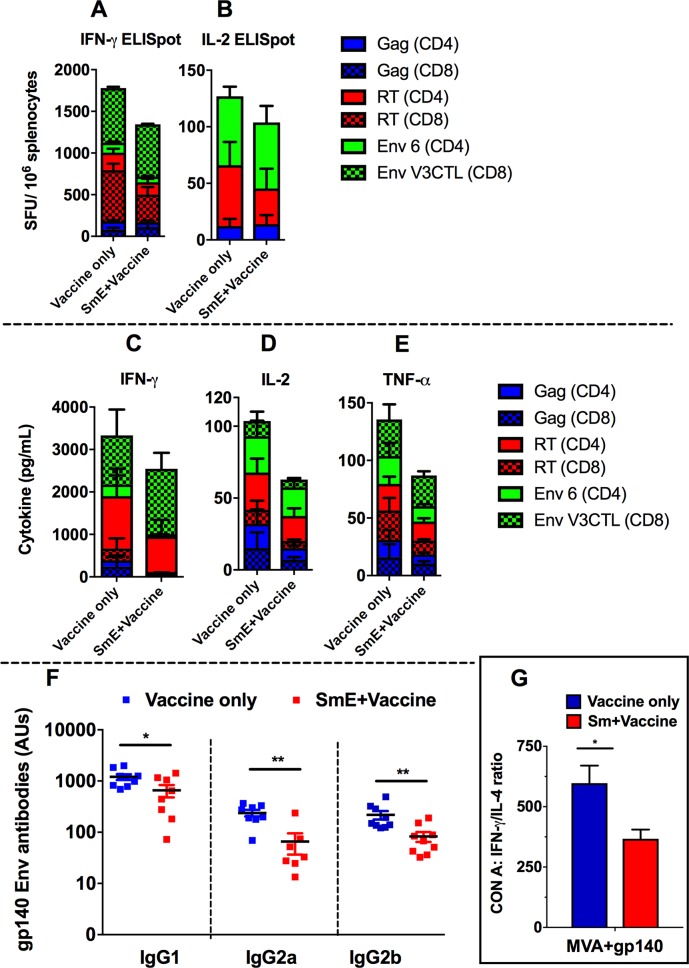
Fig 4. Cellular and antibody responses to HIV vaccines in SmE inoculated mice.
Spleens and blood were collected 12 days after the last vaccination. Splenocytes were stimulated the induced cytokines were analysed in an IFN-γ (A) and IL-2 (B) ELISpot, cytokine bead array (CBA) (C, D, and E) assays. The individual bars represent the magnitudes of the cumulative cytokine levels. HIV-1 Env gp140-specific IgG1, IgG2a and IgG2b antibodies were analysed in the sera by an ELISA (F). Values are expressed as antibody units and the mean (AUs) for the 8–12 animals in each group shown as a horizontal bar. An IFN-γ:IL-4 ratio (G) was calculated from the CBA data. Results represent 3 independent experiments. Statistical analysis was performed using unpaired, two-tailed t-test analysis. (*: p<0.05; **: p<0.01).

