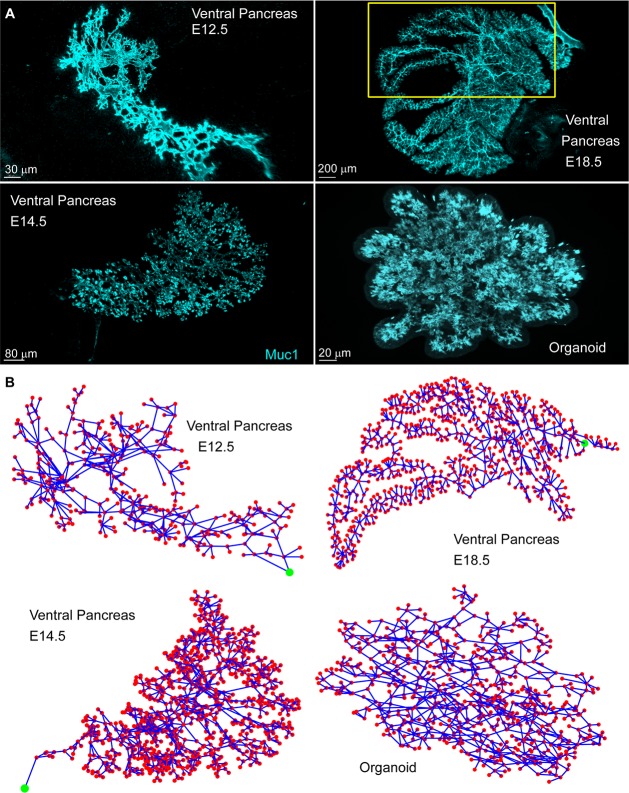
Fig 1. Digitized pancreas networks.
Presented both in (A) their raw image format and (B) digitized. The red dots represent the mapped nodes, while the blue lines represent the mapped links. The green circle represents the exit from the pancreas (the organoids do not have an exit). The yellow box shows the mapped section of the E18.5 pancreas. Digitized data and code files “Import_Experimental_data”, “PlotNetwork” are provided in supporting information (S1 Data). E, embryonic day; Muc1, mucin1

