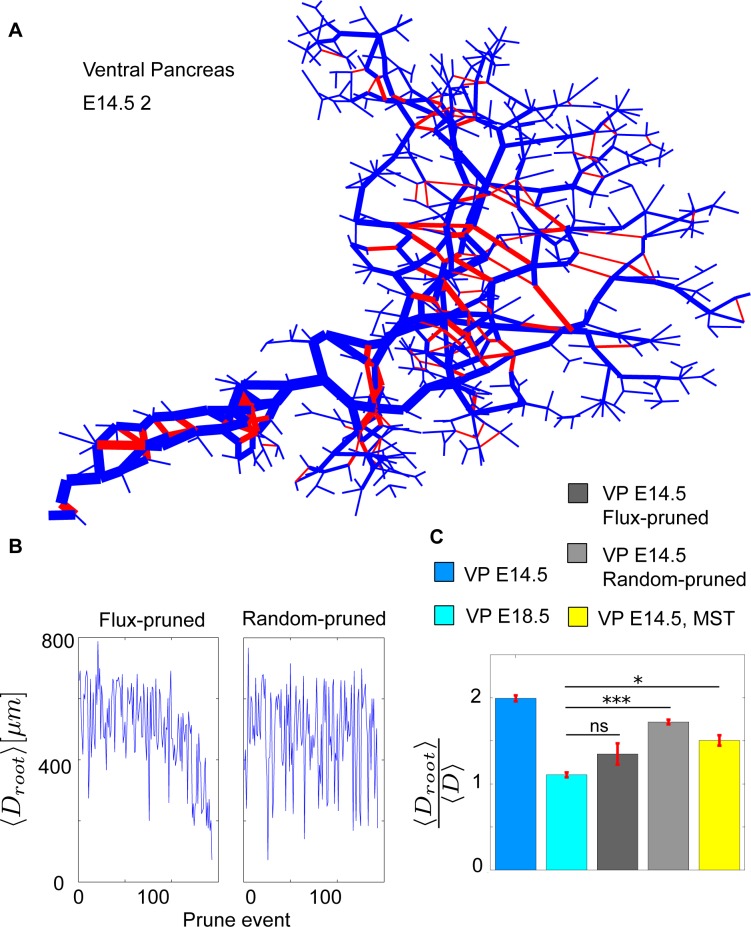
Fig 5. Flux-based pruning of the VP14.5 networks.
(A) The logarithm of the normalized flux at steady state of the E14.5 2 pancreas network. Thicker links indicate a higher flux. The highest flux is closest to the exit, with some interlinking nodes having very low flux. The links highlighted red are pruned by the pruning mechanism of least flux. (B) The pruning event's distance from the exit as pruning progresses for flux-based pruning and random pruning. (C) Average distance of all nodes to the exit scaled by the average distance between all nodes shown for the networks of E14.5, E18.5, the in silico pruned E14.5, and the E14.5 MST. Error bars represent SEM. Code files “Import_Experimental_data”, “DiffusionOnNetwork”, “PruneBasedOnFlux”, “SnapShot”, “ConvertToAdjMat”, “ConvertToAdjList”, “NetworkProp”, “NetworkShapes”, “FindTriangles”, “Remove_kinks” are provided in supporting information (S1 Data). E, embryonic day; MST, minimum spanning tree; ns, not significant; VP, ventral pancreas.

