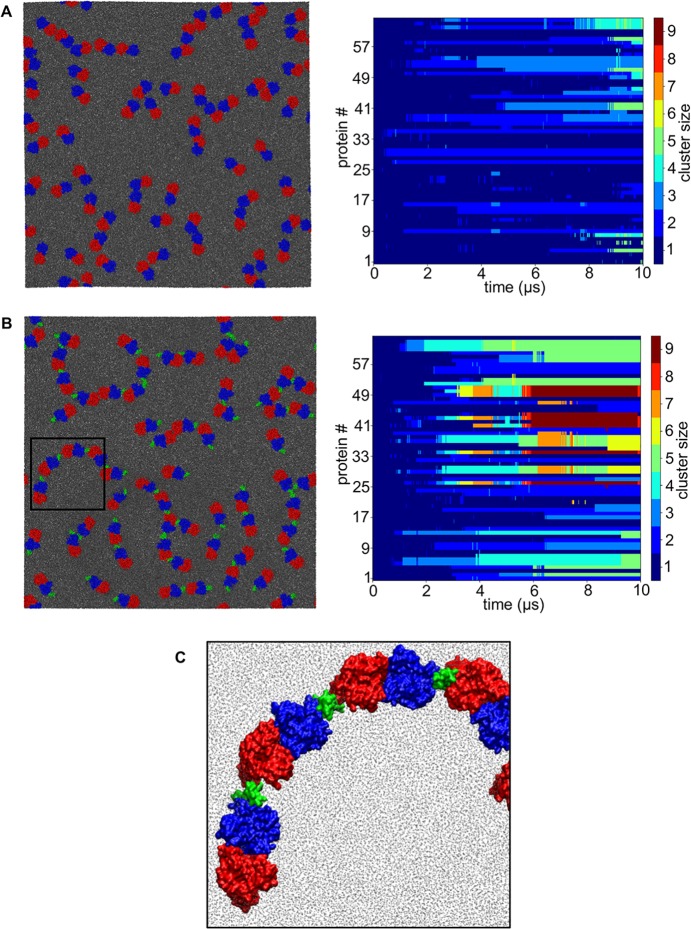
Fig 7. GPA promotes Band 3 clustering.
A,B. Final snapshot of the simulations with the mdAE1 dimer and mdAE1/GPA complexes. The mdAE1 monomers are shown in red and blue and the GPA in green. Next to each simulation snapshot we show the clustering of proteins during the simulation as a function of time. Each line represents one protein in our simulation system and each color shows the association of each protein with a specific cluster. C. Zoom-in a region of the simulation in B showing the alternating arrangement of the mdAE1/GpA complex. See also S10 Fig.

