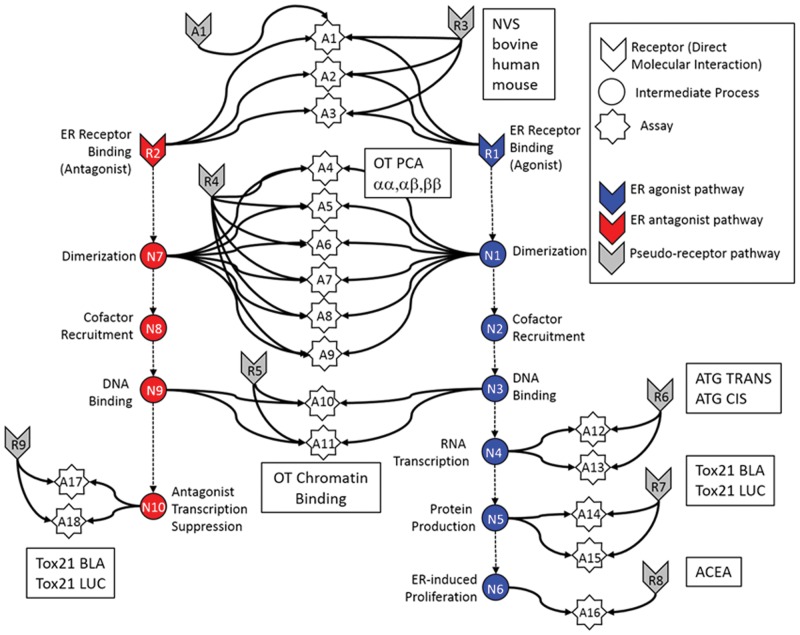
FIG. 1.
High throughput assays integrated into an ER predictive pathway model. Graphical representation of the computational network used in the in vitro analysis of the ER pathway across assays and technology platforms for EDSP Pivot. Colored arrow nodes represent “receptors” with which a chemical can directly interact. Colored circles represent intermediate biological processes that are not directly observable. White stars represent the in vitro assays that measure activity at the biological nodes. Arrows represent transfer of information. Gray arrow nodes are the pseudo-receptors. Each in vitro assay (with the exception of A16) has an assay-specific pseudo-receptor, but only a single example is explicitly shown, for assay A1. Source: Judson et al. 2015 (reuse permission license number 3903120062524).

