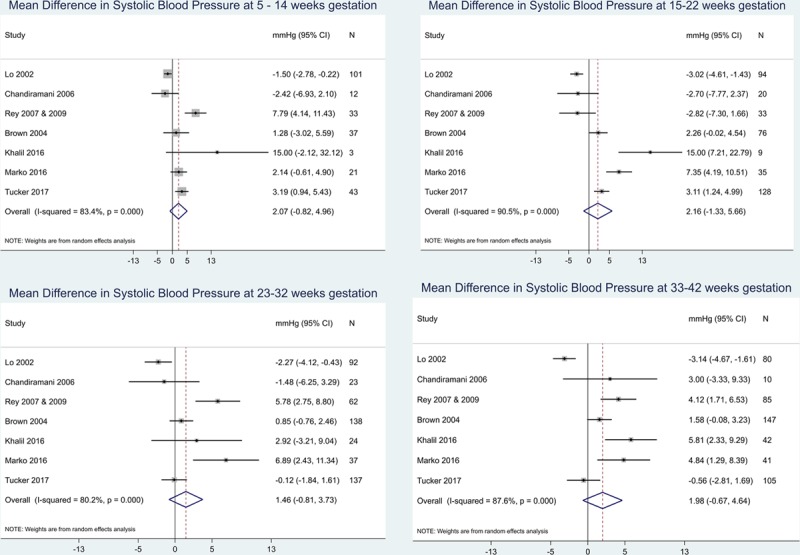
Figure 2.

Comparison of clinic and self-monitored systolic blood pressure (BP). Forest plots were constructed to examine the difference in mean BP (clinic–home) by the type of monitoring and study group. Data were analyzed as continuous variables and presented here in mm Hg, plotted by gestational stage. CI indicates confidence interval.
