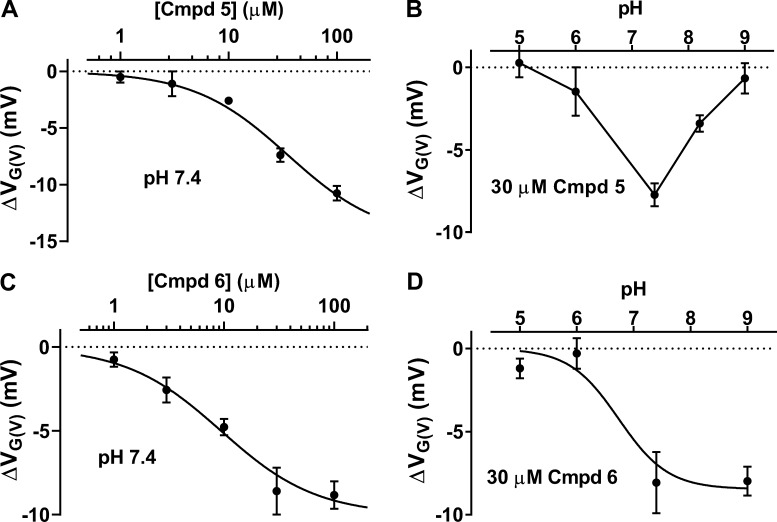
Figure 6.
Characterization of the effects of Cmpd 5 and Cmpd 6 on the WT Shaker KV channel. (A) Concentration–response curve for Cmpd 5–induced shift of the G(V). Mean ± SEM (n = 2–4). Best fit of Eq. 3: ΔVG(V),max = −14.8 ± 1.5 mV; c1/2 = 35 ± 9 µM. (B) pH dependence of Cmpd 5–induced ΔVG(V) (30 µM). Mean ± SEM (n = 3). Data points connected with line. (C) Concentration–response curve for Cmpd 6–induced shift of the G(V). Mean ± SEM (n = 3–6). Best fit of Eq. 3: ΔVG(V),max = −10.0 ± 0.9 mV; c1/2 = 9.4 ± 3.2 µM. (D) pH dependence of Cmpd 6–induced ΔVG(V) (30 µM). Mean ± SEM (n = 3–5). Best fit of Eq. 3: ΔVG(V),max = −8.5 ± 0.9 mV, apparent pKa = 6.7.

