Figure 6.
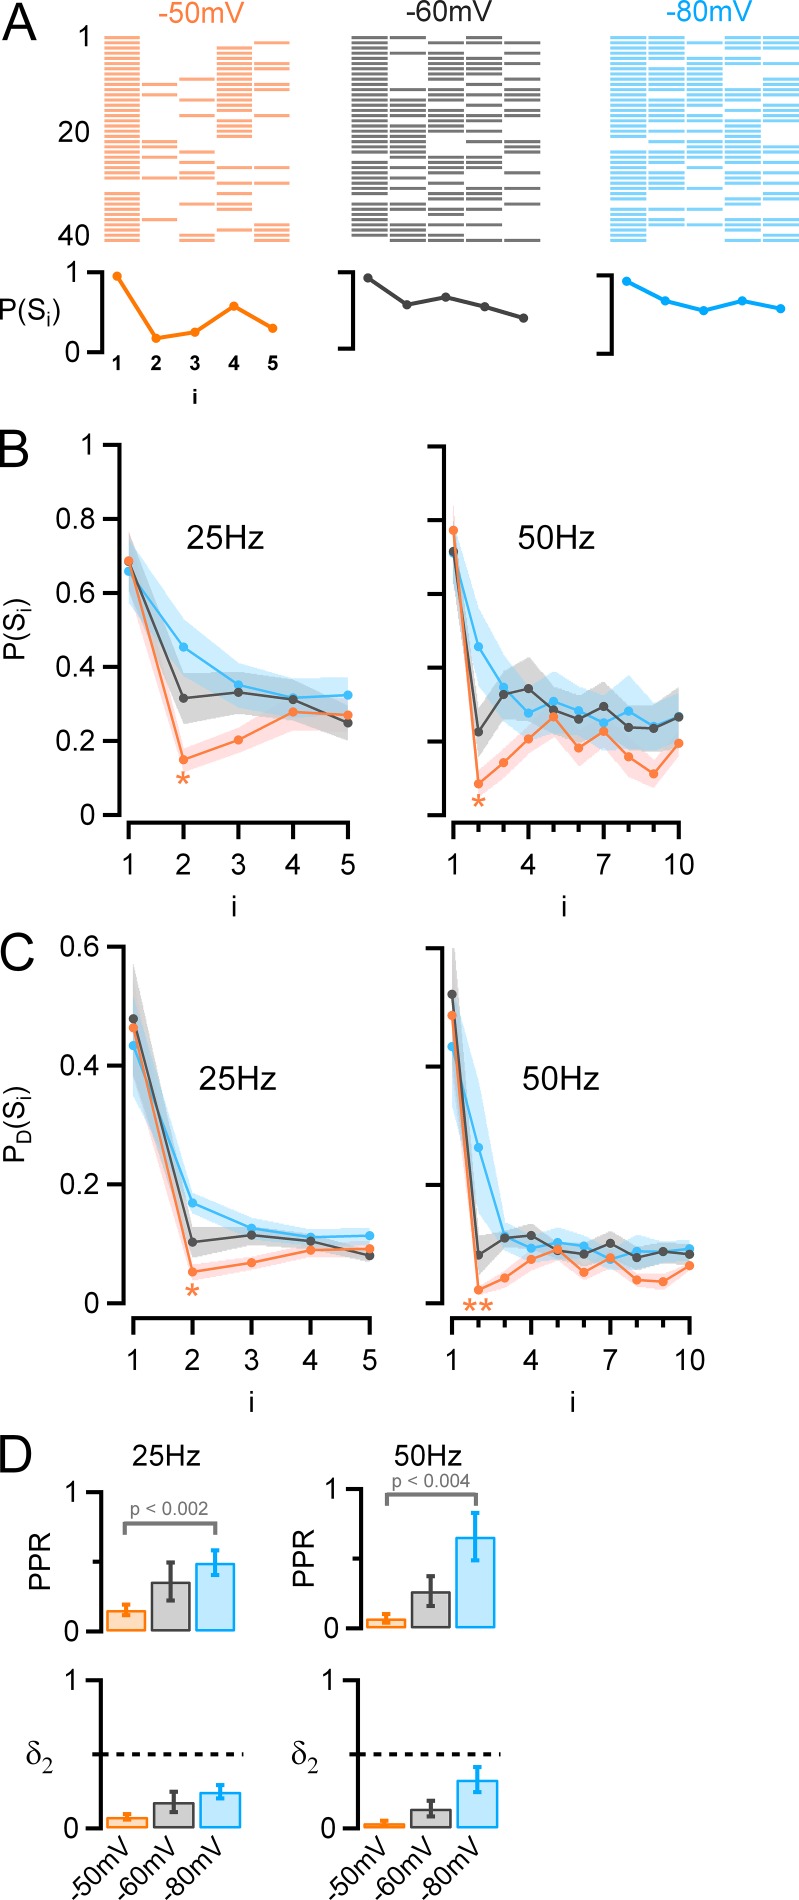
Effect of presynaptic holding potential on synaptic success rate and on docking site release probability. (A) Top: Success (colored bars)/failure (white) sequences for a series of 40 consecutive trials. Bottom: Synaptic success probability as a function of i (P[Si]), showing increased synaptic depression with depolarizing holding potential (red, −50 mV; black, −60 mV; blue, −80 mV; same experiment as in Fig. 5, B and C). (B) Group results (25 Hz, n = 12; 50 Hz, n = 8) showing that the success probability at i = 1 is not affected by prepulse holding potential; however, from i = 2, there is a decrease in success probability with presynaptic depolarization. This effect is strongest for i = 2 and i = 3. (C) Release probability per docking site (PD[Si]) as a function of i, showing, as in B, in depolarizing conditions a strong depression in response to the second AP followed by a rebound. (D) Top: PPR values derived from C as a function of holding potential, showing a strong reduction with depolarization (mean ± SEM, 25 Hz: 0.15 ± 0.04 at −50 mV, 0.36 ± 0.04 at −60 mV, 0.5 ± 0.09 at −80 mV; 50 Hz: 0.07 ± 0.03 at −50 mV, 0.27 ± 0.1 at −60 mV, 0.66 ± 0.17 at −80 mV). Bottom: Estimated docking site occupancy before the second stimulation as a function of holding potential (mean ± SEM, 25 Hz: 0.08 ± 0.02 at −50 mV, 0.18 ± 0.07 at −60 mV, 0.25 ± 0.04 at −80 mV; 50 Hz: 0.03 ± 0.01 at −50 mV, 0.13 ± 0.05 at −60 mV, 0.33 ± 0.08 at −80 mV). In B and C, statistically significant differences between the results for i = 2 and the results at steady state are indicated as follows: *, P < 0.05; **, P < 0.01.

