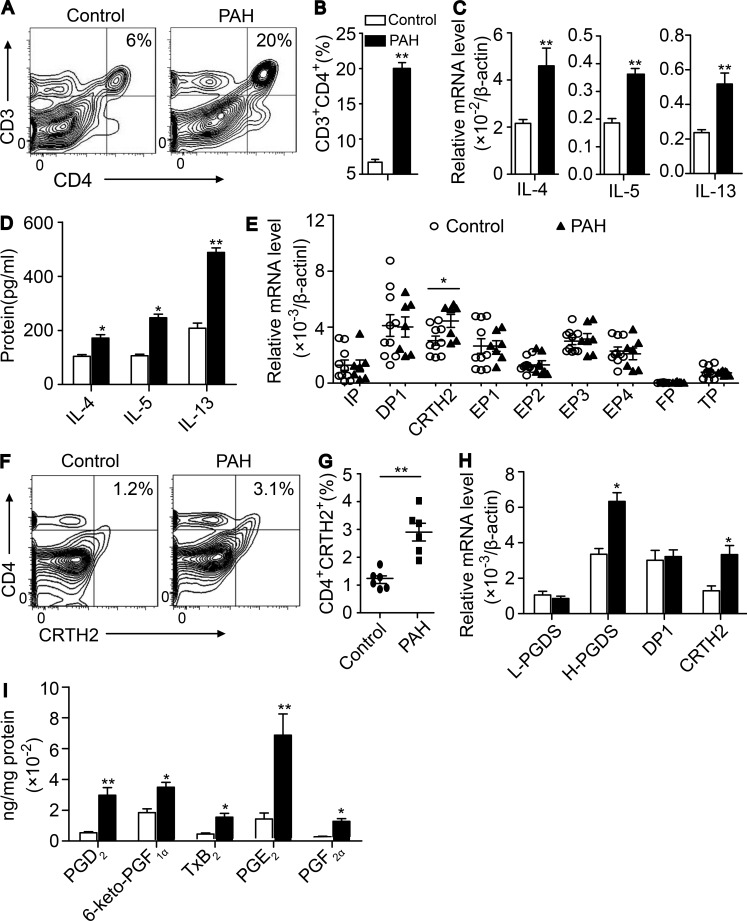
Figure 1.
Circulating Th2 cells and CRTH2 expression in T cells are increased in patients with idiopathic PAH and mice exposed to hypoxia. (A–D) Activated Th2 response in lung tissues of chronic hypoxia-challenged mice. (A) Flow cytometric analysis of CD3+CD4+ T cells in lung tissues. (B) Quantification of the frequency of CD3+CD4+ T cells in lung tissues. (C) Relative mRNA expression of IL-4, IL-5, and IL-13 in CD4+ T cells in lung tissues. (D) Quantification of IL-4, IL-5, and IL-13 protein levels in BALF by ELISA. In A–D, n = 6–8 mice per group. *, P < 0.05; **, P < 0.01 versus normoxia group. (E) Relative mRNA levels of PG receptors in isolated CD4+ T cells from patients with PAH and healthy subjects. Patients, n = 7; healthy subjects, n = 10. *, P < 0.05 versus healthy subjects. (F) CRTH2 expression in CD4+ T cells from patients with PAH and healthy subjects by flow cytometry. (G) Quantification of the frequency of CD4+CRTH2+ T cells in white blood cells from patients with PAH and healthy subjects. Patients, n = 6; healthy subjects, n = 6. **, P < 0.01 versus healthy subjects. (H) Relative mRNA levels of L-PGDS, H-PGDS, and PGD2 receptors (DP1 and CRTH2) in CD4+ T cells isolated from lung tissues of mice exposed to chronic hypoxia. L-PGDS = lipocalin-type PGD2 synthase; H-PGDS = hematopoietic PGD2 synthase. (I) PG production in the lung tissues of hypoxia-challenged mice analyzed by LC-MS. In H and I, n = 6–8 mice per group. *, P < 0.05; **, P < 0.01 versus normoxia group. All graphs are shown as mean ± SEM. Data are representative of at least two independent experiments. Statistical significance was determined using unpaired Student’s t tests. PGF2α, prostaglandin F2α; TxB2, thromboxane B2; PGE2, prostaglandin E2.

