Figure 5.
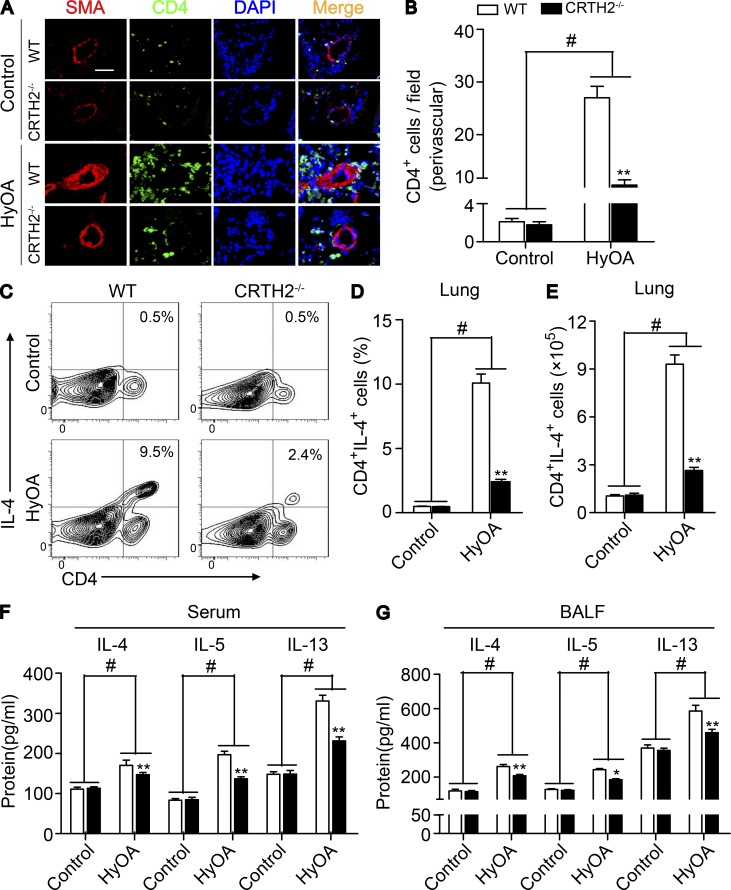
CRTH2 knockout reduces Th2 immune responses in the lungs of HyOA-treated mice. (A) Representative immunostaining images of CD4 (green) and SMA (red) in lung sections from HyOA-treated WT and CRTH2−/− mice. Bar, 20 µm. (B) Quantification of perivascular CD4+ cells in lung tissues as shown in A. (C–E) Representative flow cytometry charts (C) and quantification of the frequency (D) and number (E) of CD4+IL-4+ cells in lung tissues from HyOA-treated WT and CRTH2−/−mice. (F and G) Quantification of IL-4, IL-5, and IL-13 levels in peripheral blood (F) and BALF (G) by ELISA. In A–G, n = 8–12 mice per group. *, P < 0.05; **, P < 0.01 versus WT; and #, P < 0.05 versus control. Representative data are shown as mean ± SEM derived from two independent experiments. Statistical significance was determined using two-way ANOVA followed by a Bonferroni post hoc test or unpaired Student’s t tests.

