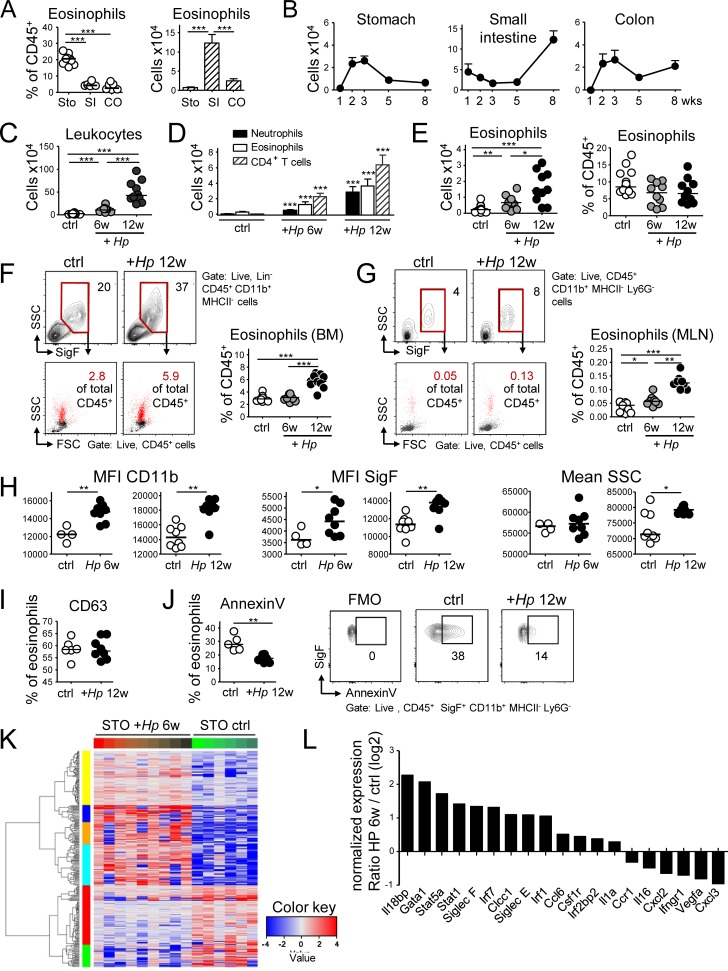
Figure 1.
Comparative analysis of the evolution and composition of the murine GI LP eosinophil population at steady-state and during H. pylori infection. (A) Frequencies (in percent of live CD45+ leukocytes) and absolute counts per organ of CD11b+MHCII−Ly6G−Siglec-F+ eosinophils in the three indicated compartments in 8-wk-old mice. n = 6–8; STO, stomach; SI, small intestine; CO, colon. (B) Absolute eosinophil counts per organ at the indicated age (in weeks). n = 4–5 per time point, shown as mean + SEM. (C–L) Eosinophil recruitment to, and activation in, the H. pylori–infected gastric LP at 6 and 12 wk post infection (p.i.), as assessed by flow cytometry and RNA sequencing. (C) Absolute numbers of CD45+ leukocytes in the gastric LP; n = 10–15, pooled from two independent studies. (D) Absolute numbers of the indicated gastric LP leukocyte populations of the mice shown in C. (E) Gastric LP eosinophil numbers and frequencies of the mice shown in C. (F) Frequencies of eosinophils in the BM of the mice shown in C, shown with representative FACS plots of eosinophils as identified by their Siglec F staining and granularity and back-gated into FSC/SSC plots of all CD45+ live cells. Lineage markers include CD3, CD4, B220, TCRα/β, NK 1.1, Ter119, and GR1. (G) Frequencies of eosinophils in the MLNs of the mice shown in C; representative FACS plots show the same gates as in F. In C–G, four and eight control mice were age-matched to the 6- and 12-wk infection, respectively. (H) Activation state of the gastric LP eosinophils shown in E, as assessed by CD11b and Siglec-F expression and side scatter. MFI, mean fluorescence intensity. (I) Frequencies of degranulated eosinophils as identified by their CD63 expression, of all gastric LP eosinophils at 12 wk p.i. (J) Frequencies of apoptotic eosinophils as identified by Annexin V binding, of all gastric LP eosinophils at 12 wk p.i. relative to controls, shown with representative FACS plots. (K) Heat map of the top 100 most differentially regulated transcripts in FACS-sorted gastric LP eosinophil samples from nine infected relative to six naive mice. (L) Selected log2 expression ratios of transcripts potentially associated with either regulatory or pro-inflammatory functions of eosinophils. *, P < 0.05; **, P < 0.01; ***, P < 0.001, as calculated by Mann-Whitney test. Horizontal lines in scatter plots indicate medians throughout. Each symbol represents one mouse.

