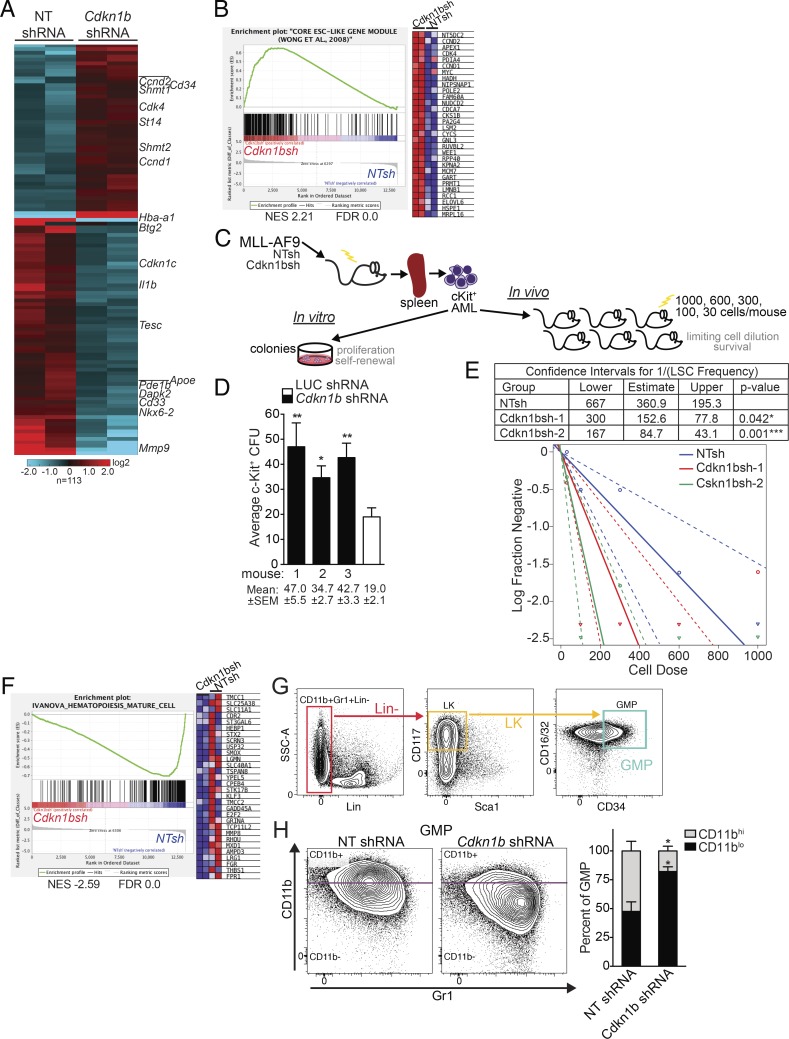
Figure 3.
miR-196b targets Cdkn1b to regulate leukemia stemness and differentiation programs in MLL-AF9 leukemia. (A) Heatmap of gene expression in Cdkn1b shRNA-knockdown and NT-shRNA control leukemias. Hierarchical clustering of 113 differentially expressed genes showing greater than twofold change in expression by RNA-seq analysis of NT-shRNA control (n = 2) or Cdkn1b shRNA (n = 2) expressing MLL-AF9 leukemic splenocytes. (B) GSEA plot ranking ESC core gene set along descending fold change gene expression in Cdkn1b-knockdown (n = 2) versus NT control leukemias (n = 2) by RNA-seq. Expression of the top subset of leading edge genes is shown. NES, normalized enrichment score. (C) Schematic illustrating in vitro colony forming assay and in vivo limiting cell dilution transplantation assay to quantify functional stem cells from freshly isolated Cdkn1b shRNA and NT control MLL-AF9 leukemias. (D) In vitro leukemic stem cell analysis. Average CFU ± SEM from c-Kit+ leukemic splenocytes from individual Cdkn1b shRNA (n = 3) or control shRNA MLL-AF9 moribund mice. Mean numbers of CFU ± SEM indicated below. A representative experiment is shown. Statistical significance evaluated by t test. *, P ≤ 0.05; **, P ≤ 0.01. (E) In vivo quantitation of leukemic stem cells by limiting dilution. Sublethally irradiated mice transplanted with a cell dose range of 1,000, 600, 300, 100, and 30 cells (n = 6 mice/dose) were followed for 90 d. LSC frequencies and statistical comparisons for pairwise differences in active cell frequencies (table and log-fraction plot) between Cdkn1b-knockdown groups and NT control group were calculated by ELDA software (see Fig. S3 [E–G] for corresponding survival curves). Statistically significant differences in LSC frequencies of NTsh control (1/360.9) versus Cdkn1bsh1 (1/152.6); *, P = 0.042 and NTsh control (1/360.9) versus Cdkn1bsh2 (1/84.7) ***, P = 0.001. (F) GSEA plot ranking mature hematopoietic cells gene set along descending fold change gene expression in Cdkn1b-knockdown versus NT control leukemias by RNA-seq (n = 2/group). Expression of the top subset of leading edge genes is shown. (G) Leukemic GMP gating strategy: CD11b+Gr1+ lineage negative (Lin−, red), Lin−c-Kit+ (LK, orange), and LK CD34+CD16/32+ granulocyte monocyte progenitor gate (GMP, green). (H) Flow cytometric validation of differentiation status. Representative flow plots (left) and average percentage of CD11bhi and CD11blo leukemic GMP-gate populations ± SEM (right) from spleens of moribund Cdkn1b shRNA or control NT shRNA MLL-AF9 mice (n = 3/group). *, P < 0.05 for CD11bhi and CD11blo GMP in Cdkn1b shRNA versus NT shRNA by two-way ANOVA.

